


INTRODUCTION
Inflammatory bowel diseases (IBDs), which include Crohn’s disease (CD) and ulcerative colitis, are chronic inflammatory disorders of the gastrointestinal tract. Although the precise etiology of IBD remains unknown, it is believed to be caused by a combination of immune, dietary, and gut microbial factors in genetically susceptible individuals [1-3]. In Japan, there has been no significant change in the genetic background in recent decades, but the prevalence of IBD has dramatically increased. This suggests a significant role for environmental factors such as hygiene, dietary habits, and gut microbiota rather than genetic factors in the pathogenesis of IBD [4-6].
Dysbiosis in the gut is defined as negative alterations of the microbial community, which is associated with health and disease [7]. Previous studies using fecal or mucosal samples identified dysbiosis in IBD, which is characterized by the reduced abundance of the phylum Firmicutes (e.g., Faecalibacterium, Roseburia, and Ruminococcus) and an increase of the phylum Proteobacteria (e.g., Enterobacteriaceae) [7-11]. These changes result from a disruption of the anaerobic environment in the colon and lead to a reduction of anti-inflammatory activity through the reduced abundance of butyrate-producing anaerobes [8,12]. A recent multi-omics study showed functional dysbiosis in the gut microbiome of IBD patients, which is characterized by molecular disruption of microbial transcription, metabolite pools (acylcarnitines, bile acids, and short-chain fatty acids), and antibodies in host serum [13].
Bile acids are metabolized by the gut microbiota and this is a central process for maintaining homeostasis in the gastrointestinal tract [14]. Liver-produced primary bile acids (PBAs), such as cholic acid (CA) and chenodeoxycholic acid (CDCA), are conjugated with glycine or taurine to increase water solubility before excretion into the biliary duct. These PBAs promote lipid digestion and absorption via their amphipathic properties. Conjugated PBAs are metabolized by 2 bacteria-mediated processes, bile acid deconjugation and 7α-dehydroxylation [14,15]. The first step is mediated by bile salt hydrolases (BSHs), which deconjugate taurine and glycine from conjugated forms and reform the unconjugated PBAs. This step is mediated by most major gut microbiota that possess BSHs. Unconjugated bile acids are passively reabsorbed, whereas conjugated bile acids are actively reabsorbed in the distal ileum [16]. The second step is 7α-dehydroxylation in the distal ileum and colon, by which unconjugated PBAs (CA and CDCA) are converted to secondary bile acids, such as deoxycholic acid (DCA) and lithocholic acid (LCA) [14,15]. At present, only a few bacteria are known to mediate this step [14].
The alteration of fecal bile acid profiles has been reported repeatedly in patients with IBD [17-19]. Duboc et al. [19] focused on patients with colonic IBD and found increased fecal conjugated PBAs and decreased secondary bile acids. Similar results have been reported by Franzosa et al. [17]. They analyzed fecal samples of CD patients using liquid chromatography-mass spectrometry metabolomic and shotgun metagenomic profiling and found the complementary depletion of the secondary bile acids DCA and LCA and a relative overabundance of PBAs. Thus, previous studies using fecal samples suggest a disruption of bile acid transformation activity in the IBD microbiome.
At present, there are few reports concerning the relationship between bile acid metabolism and microbial structure in the small intestine of human IBD patients. In this study, using samples obtained by balloon-assisted enteroscopy (BAE), we comprehensively analyzed the mucosa-associated microbiome (MAM) and bile acid metabolites in the small intestine of patients with CD.
METHODS
1. Ethical Considerations
This study was approved by the Ethics Committee of Shiga University of Medical Science (approval No. R2016-111) and registered with the University Hospital Medical Information Network Center (UMIN000033267). All participants were recruited from the Shiga University of Medical Science Hospital, and written informed consent was obtained from each participant prior to enrolment.
2. Patients and Sample Collection
Twelve non-CD controls and 38 CD patients under clinical remission (Crohn’s disease activity index < 150) [20] were enrolled (Table 1). For microbial analysis, a sufficient amount of DNA was not recovered from some samples. Therefore, the MAM was evaluated in 9 samples from the non-CD controls and 27 samples from the CD patients. Due to the failure of sample collection, 10 samples from the non-CD controls and 33 samples from the CD patients were subjected to bile acid analysis. The samples taken from ulcerated lesions were defined as “active” and those taken from endoscopically normal mucosa without inflammation as “inactive.” The patient characteristics of active and inactive CD patients were shown in Supplementary Table 1.
BAE using a SIF-Q260 (Olympus, Tokyo, Japan) was performed via the anal route with a polyethylene glycol-based bowel preparation. Mucosal samples for MAM analysis were obtained by gentle brushing of mucosal surfaces using a cytology brush (CCB-7-240-3-S; Cook Medical, Bloomington, IN, USA). Intestinal fluid for bile acid analysis was aspirated using an endoscopic catheter (ES-825H; Yasec Co., Ltd., Shiga, Japan) from the distal ileum (approximately 50 cm on the oral side from Bauhin’s valve).
3. 16S rRNA Gene Sequencing and Sequence Curation
The composition of the microbiota was determined by analysis of a median 28,132 (1,139-73,931) paired (median) reads per sample of the ~250 bp v4 region of the 16S rRNA gene by Illumina MiSeq sequencing, as described previously [21]. An amplicon library was prepared and sequenced at the Sequencing Core of the University of Michigan Host Microbiome Initiative. The paired-end sequences were curated and binned into operational taxonomic units (OTUs) at > 97% identity level and taxonomically assigned using the 16S rRNA gene training set version 16 of the Ribosomal Database Project by Mothur (1.40.5) [22,23].
4. Bile Acid Analysis of Intestinal Fluid
Bile acid concentrations of intestinal fluid were determined by liquid chromatography-tandem mass spectrometry (LC-MS/MS) as described previously [24]. Briefly, after the addition of internal standards and 2 mL of 0.5 M potassium phosphate buffer (pH 7.4) to 20 μL intestinal fluids, bile acids were extracted with Bond Elut C18 cartridges (Agilent Technologies, Santa Clara, CA, USA) [25]. An aliquot of the extract was subjected to LC-MS/MS using a TSQ Vantage triple stage quadrupole mass spectrometer (Thermo Fisher Scientific, Waltham, MA, USA) equipped with an HESI-II probe and a Prominence ultra-fast liquid chromatography system (Shimadzu, Kyoto, Japan). Chromatographic separation was performed using a Hypersil GOLD column (150 × 2.1 mm, 3 μm; Thermo Fisher Scientific) at 40°C.
5. Statistical Analysis
Nonparametric data were compared between groups with the Mann-Whitney U test using Prism version 8.01 (GraphPad, San Diego, CA, USA) and JMP software version 14.0 (SAS Institute, Cary, NC, USA). Spearman rank correlation coefficients were used to evaluate the correlations between the parameters. P-values were two-sided, with statistical significance set at P<0.05. The observed species and the Chao1 and Shannon phylogenic diversity indices were calculated using PRIMER7, version 7.0.13 (PRIMER-e, Auckland, New Zealand). β-Diversity was estimated using the UniFrac metric to calculate the distances between the samples, and then visualized using non-metric multidimensional scaling (NMDS) ordination and statistically analyzed by permutational multivariate analysis of variance (PERMANOVA) using QIIME version 1.9. Linear discriminant analysis coupled with effect size measurements values of OTUs was performed using mothur [22,23].
RESULTS
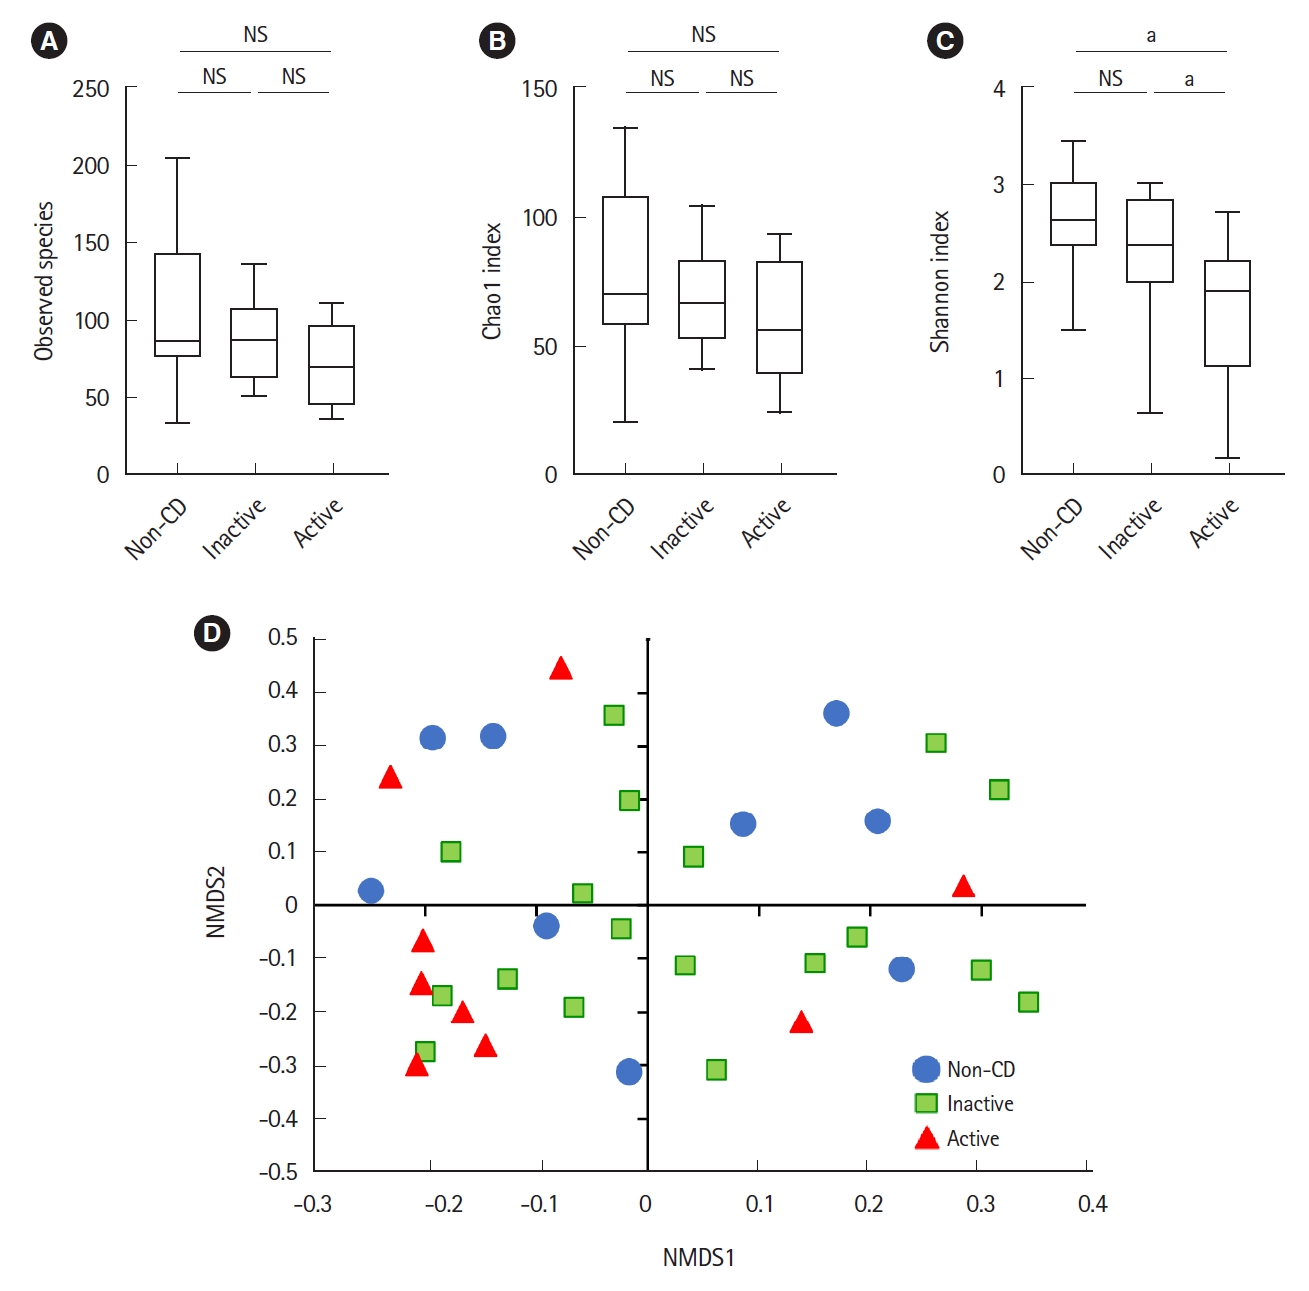
Microbial analysis revealed a total of 592 OTUs among 36 samples. The Shannon evenness index was significantly lower in endoscopically active lesions than in inactive lesions and nonCD controls (Fig. 1A-C). However, there was no difference in the observed species and Chao-1 index (richness markers). β-Diversity was evaluated using the UniFrac metric to calculate the distance between the samples (Fig. 1D). A significant difference was detected only between active lesions and nonCD controls (P=0.039, PERMANOVA). There was no significant difference between endoscopically inactive lesions and non-CD controls (Fig. 1D).
As shown in Fig. 2, the relative abundance of the phylum Firmicutes was significantly lower in active lesions than in non-CD controls. The relative abundance of the phylum Fusobacteria was significantly higher in inactive lesions than in non-CD controls. The relative abundance of the phylum Actinobacteria was significantly lower in active lesions than in inactive lesions.
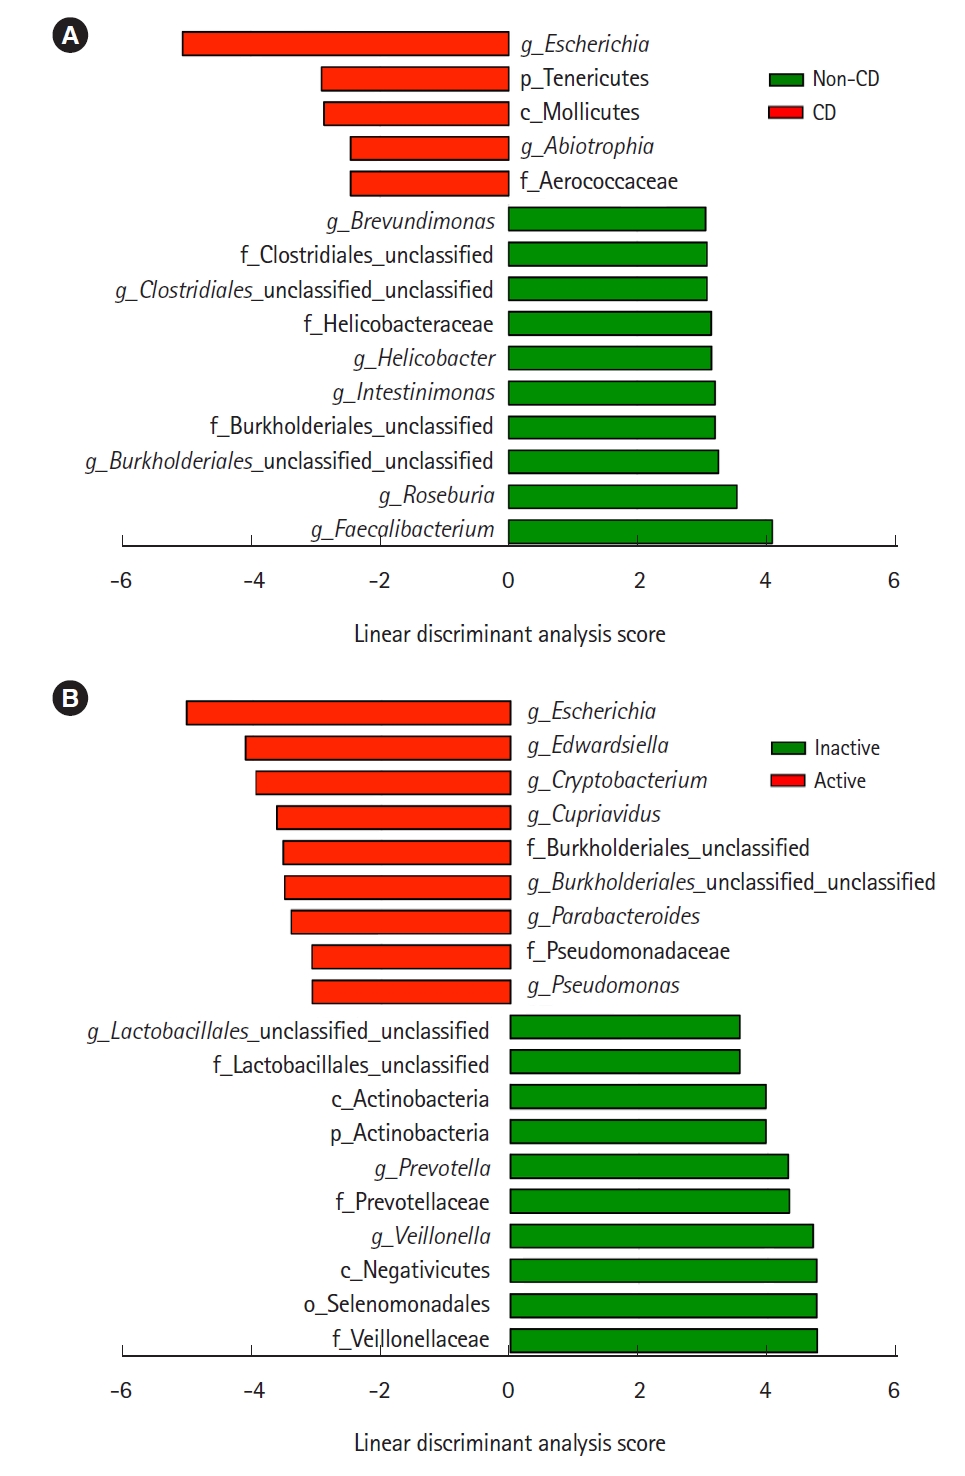
Representative taxa showing a significant difference in abundance are shown in Fig. 3. When comparing CD samples and non-CD controls, the relative abundance of the genus Escherichia was significantly higher in CD samples, while the genera Faecalibacterium and Roseburia were significantly lower in CD patients (Fig. 3A). The relative abundance of the genera Escherichia, Edwardsiella, and Cryptobacterium was significantly higher in active lesions than in inactive lesions, and the genera Veillonella and Prevotella were significantly less abundant in active lesions than in inactive lesions (Fig. 3B).
Bile acid composition expressed by non-metric multidimensional scaling was significantly different between the active CD and non-CD samples (P=0.033, PERMANOVA) (Fig. 4A). Total bile acid concentrations were significantly higher in CD samples than in non-CD samples (38.4 μM vs. 4.55 μM, respectively, P=0.01) (Fig. 4B). There was no significant difference between both groups in the proportion of primary or secondary bile acids (Fig. 4C and D). The proportion of conjugated bile acids was significantly higher in CD patients than in non-CD controls (Fig. 4E), while the proportion of unconjugated bile acids was significantly lower in CD patients (Fig. 4F). There was no difference in the ratio of glycine-conjugated to taurine-conjugated bile acids between both groups (Fig. 4G).
As shown in Table 2, analysis of the bile acid fraction indicated that the proportion of all unconjugated bile acids was relatively lower in CD patients than in non-CD controls. In particular, the proportions of CA and LCA were significantly lower in CD patients than in non-CD controls. The proportion of DCA tended to be lower in CD patients but not significant (P=0.054). On the other hand, the proportions of conjugated bile acids such as glycocholic acid (GCA) were significantly higher in CD patients than in non-CD controls. The comparison of the bile acid fraction between active and inactive CD revealed significantly decreased glycodeoxycholic acid (GDCA) in active CD than in inactive CD (Supplementary Table 2).
Bile acid metabolism is closely associated with the gut microbiome [14]. Therefore, we evaluated whether there was a correlation between the relative abundance of taxa and the proportion of conjugated bile acids. Representative taxa whose abundance was significantly correlated with the proportion of conjugated bile acids are shown in Table 3. The genera Escherichia and Lactobacillus were positively correlated with the proportion of conjugated bile acids. On the other hand, the families Lachnospiraceae (genus Roseburia), Peptostreptococcaceae (Intestinibacter) and Ruminococcaceae (Faecalibacterium) were negatively correlated with the proportion of conjugated bile acids.
DISCUSSION
There is an increasing number of reports describing a role for the gut microbiota and/or bile acid metabolism in the pathogenesis of IBD [7-11,17-19]. However, most of these studies used fecal or colonic mucosa samples, and due to the difficulty in sample collection, only a few reports have evaluated microbial structure and bile acid metabolism in the small intestine of human IBD patients. In this study, we analyzed ileal samples collected using BAE according to our previously reported method [11]. To our knowledge, this is the first study demonstrating the coupled alteration of the gut microbiome and bile acid metabolism in the ileal mucosa of patients with CD.
Regarding microbial diversity, we have previously shown that the MAM isolated from the colonic mucosa of CD patients was clearly different from that of healthy controls [11]. Such a difference was evident in the inactive mucosa of CD patients [11]. In this study, however, we did not detect such a clear difference in the α- and β-diversities of the ileal MAM in CD patients. We detected a significant difference only between active lesions and non-CD controls, but not between inactive lesions and non-CD controls. Nagayama et al. [26] also reported that there was no significant change in the diversity of the small intestinal MAM of CD patients. These findings indicate that the alteration of microbial structure in the small intestinal mucosa of CD patients is modest as compared with the previously reported findings in the colonic mucosa of CD patients [11]. The mucus layer in the small intestine is relatively thin and contains antimicrobial peptides and secretory IgA as a diffusion barrier against microorganisms [27]. On the other hand, the mucus layer in the colon is thick and its dense inner layer constructs a bacteria-free zone at the epithelial surface [27]. These different mucosal environments may be one of the factors underlying the contrasting observations of microbial diversity between the small intestine and colon.
The present study showed the decreased abundance of the phylum Firmicutes and the increased abundance of Fusobacterium in the ileal mucosa of CD patients. We also observed a significant decrease in butyrate-producing bacteria, such as the genera Faecalibacterium and Roseburia (obligate anaerobes), and a significant increase in the genus Escherichia (facultative anaerobes) in CD patients. The increase of Escherichia was more prominent in active lesions than in inactive lesions. These findings are compatible with the microbial changes in the colonic mucosa of CD patients [11]. Litvak et al. [28] recently described one of the mechanisms underlying such an alteration of the microbiome in the intestine. Oxygen is supplied by diffusion from blood vessels in the intestine. Under normal conditions, butyrate-producing obligate anaerobes keep the epithelial cells under high oxygen consumption and maintain luminal anaerobic conditions [28]. However, inflammation induces epithelial oxygenation and subsequent oxygen diffusion into the lumen, thereby driving an expansion of facultative anaerobes such as Proteobacteria (Escherichia) through aerobic respiration [12]. Thus, the dysbiosis observed in the present study could be explained by a complexed interaction between the decrease of butyrate-producing bacteria, increase of epithelial oxygenation, oxygen diffusion into the lumen, and expansion of facultative bacteria (Proteobacteria).
Nagayama et al. [26] reported an alteration of MAM in the small intestine of CD patients. They showed that Escherichia coli and Ruminococcus gnavus (mucolytic pathobiont) were particularly associated with CD patients and identified a Th1 cell-inducing E. coli strain. However, they did not observe changes of butyrate-producing obligate anaerobes. They used BAE for sample collection, but their method was different from ours. We collected samples from the distal ileum (approximately 50 cm on the oral side from Bauhin’s valve), but Nagayama et al. harvested samples from active lesions of the middle small intestine (jejunum or proximal ileum). It is likely that the differences in sampling locations might have led to the different observations in these studies, since anaerobic conditions are different between the middle (facultatively anaerobic) and terminal (obligately anaerobic) small intestine.
In parallel with microbiome analyses, we analyzed bile acid composition in the ileum. We found a significant elevation of the levels of total bile acids and a significant increase in the proportion of conjugated bile acids (e.g., GCA and taurocholic acid) in CD patients. These results are partially compatible with the previous report of fecal samples by Duboc et al. [19]. They reported an increase of conjugated bile acids as well as an increase of secondary bile acids in fecal samples from active IBD patients [19]. The composition of bile acids have been reported to be determined by several processes and factors, such as the balance of passive and active absorption and bacterial bile acid modifications [16]. Since mucosal inflammation continues even without endoscopic mucosal findings in CD patients [29], the elevation of the total amount of bile acids suggests the malabsorption of bile acids over a wide area of the small intestine. The reabsorption of conjugated bile acids is dependent on their recognition by active transport sites in the terminal ileum [16], but unconjugated bile acids bind with a lower affinity to the transport sites and pass into the colon [16]. The terminal ileum is one of the most commonly affected sites in CD, and the active absorption of conjugated bile acids may be disrupted in the ileum of CD patients, leading to an increase in the proportion of conjugated bile acids.
Bacterial modification of bile acids is another process that affects bile acid composition. In this regard, deconjugation mediated by bacterial BSHs has a particular importance [30]. As described in the review by Ridlon et al. [30], BSH activity is widespread in commensal bacteria in the small intestine and colon. Gram-positive gut bacteria including Clostridium, Enterococcus, Bifidobacterium, and Lactobacillus have the most diverse distribution of BSHs, while the distribution of BSHs in Gram-negative bacteria is only detected in members of the genus Bacteroides [30]. In the present study, the abundance of the genera Escherichia and Lactobacillus was positively correlated with the proportion of conjugated bile acids. On the other hand, the abundance of the family Lachnospiraceae (the genus Roseburia), Peptostreptococcaceae (Intestinibacter), and Ruminococcaceae (Faecalibacterium) was negatively correlated with the proportion of conjugated bile acids. These results suggest that the proportion of conjugated bile acids may be increased in association with the increase of Gram-negative, BSH-lacking Escherichia and the decrease of various BSH-positive, Gram-positive bacteria such as Roseburia and Faecalibacterium.
At present, there are little clinical data on the relationship between bile acid composition and the activity of CD. Sinha et al. [15] revealed that secondary bile acids have an inhibitory effect on intestinal inflammation via transmembrane G protein-coupled receptor 5. In our study, we found a decrease in GDCA, a conjugated secondary bile acid, in active CD, suggesting that it may influence disease activity.
This study has some limitations based on the small number of samples. First, since it was difficult to perform per anal BAE without stress in healthy individuals, we could not obtain truly normal small intestine fluid. Second, our results may be affected by the bowel cleaning preparation prior to BAE. To clear the bowel, all participants took a laxative the night before sampling, and a cleaning liquid composed of polyethylene glycol on the day of sampling. These procedures might cause dilution effects on the samples of the small intestine used in this study.
In conclusion, dysbiosis in the ileum of CD patients was confirmed, but it was relatively modest as compared to previously reported findings in the colon or feces of IBD patients. In addition, dysbiosis in the ileum was accompanied with an alteration of bile acid composition. The precise role of the coupled changes of the microbiome and bile acid composition in the pathophysiology of CD should be investigated further in the future.