Selective M1 macrophage polarization in granuloma-positive and granuloma-negative Crohn's disease, in comparison to intestinal tuberculosis
Article information
Abstract
Background/Aims
Classical M1 macrophage activation exhibits an inflammatory phenotype while alternative M2 macrophage activation exhibits an anti-inflammatory phenotype. We aimed to determine whether there are discriminant patterns of macrophage polarization in Crohn's disease (CD) and intestinal tuberculosis (iTB).
Methods
Colonic mucosal biopsies from 29 patients with iTB, 50 with CD, and 19 controls were examined. Dual colored immunohistochemistry was performed for iNOS/CD68 (an M1φ marker) and CD163/CD68 (an M2φ marker), and the ratio of M1φ to M2φ was assessed. To establish the innate nature of macrophage polarization, we analyzed the extent of mitochondrial depolarization, a key marker of inflammatory responses, in monocyte-derived macrophages obtained from CD and iTB patients, following interferon-γ treatment.
Results
M1φ polarization was more prominent in CD biopsies (P=0.002) than in iTB (P=0.2) and control biopsies. In granuloma-positive biopsies, including those in CD, M1φ predominance was significant (P=0.001). In iTB, the densities of M1φ did not differ between granuloma-positive and granuloma-negative biopsies (P=0.1). Interestingly, higher M1φ polarization in CD biopsies correlated with high inflammatory response exhibited by peripheral blood-derived monocytes from these patients.
Conclusions
Proinflammatory M1φ polarization was more common in colonic mucosa of CD patients, especially in the presence of mucosal granulomas. Further characterization of the innate immune system could help in clarifying the pathology of iTB and CD.
INTRODUCTION
Crohn's disease (CD) is a consequence of aberrant immune response to environmental factors and gut microbiome, in genetically predisposed individuals. Intestinal tuberculosis (iTB) is an infectious disease caused by Mycobacterium tuberculosis. Despite their diverse etiologies, it is intriguing that their clinical presentation can be remarkably similar.1 Both the entities present with chronic intestinal inflammation as ulcero-constrictive intestinal disease. As CD is being increasingly seen in TB endemic areas, differentiating between the two can be a perplexing problem for the treating clinicians.23 Interestingly, granulomas in intestinal tissue are seen both in CD as well as iTB.1 Another intriguing aspect is that mucosal epithelioid granulomas is among the histological parameters often reported to determine the clinical severity in CD. Patients with granulomas in CD hves been shown to have more clinical severity, recurrences, frequent fistula formation and postsurgical complications than in granuloma-negative CD.45
Innate as well as adaptive immune responses play an important role in pathogenesis of CD as well as iTB. Over the last decade, it has been seen that the influence of innate immune response is possibly more as compared to adaptive immune response.678910 Reciprocal interactions between macrophages and activated T-cells trigger adaptive immune responses and cytokines released by both the macrophages and the activated T-cells, further modulate each other. Gradually, the concept of this reciprocal activation between macrophages and T-cells has expanded and it has been seen that the interferon γ (IFN-γ) released by type 1 T helper (Th1) cells and interleukin 4 (IL-4) released by the Th2 cells, activates 2 specific types of macrophage populations, the M1φ and M2φ, respectively.111213141516 Mantovani and colleagues gave a clear concept regarding the stimulators and effects of M1φ (IFN-γ combined with lipopolysaccharide [LPS] or tumor necrosis factor [TNF]) and M2 (IL-4 [M2a]; IL-10 and GCs [M2c]).17 On the other hand, macrophage subtype responsible for immune regulation, stimulated by Fc receptors and immune complexes, were termed as M2bφ by Moser and Murphy.10 Granulocyte-macrophage colony stimulating factor (GM-CSF) and macrophage colony stimulation factors (M-CSF) were identified as independent activators of M1 and M2φ.1819 Recently, we showed that classical activation of macrophages using IFN-γ alone or in combination with LPS results is increased mitochondrial depolarization, lower autophagy and increased cellular reactive oxygen species leading to activation of inflammasome pathway.20 This allowed us to envisage an intriguing hypothesis to test whether macrophages from CD patients could respond more aggressively to a common inflammatory stimulus as against those from iTB patients.
As, both CD and iTB show histological presence of mucosal lymphomononuclear cells, along with macrophages, polymorphs and epithelioid cell granulomas in a sub-set, we intended to characterize the mucosal M1φ and M2φ polarization in them. Keeping in mind, that histologically presence of epithelioid cell granuloma in CD, may be an indicator of clinical disease severity, we included cases of both granuloma-positive and granuloma-negative CD, along with iTB and control intestinal tissue, and compared the pattern of φpolarization pattern among these clinical groups.
METHODS
1. Patients and Controls
Intestinal biopsies from 29 patients with treatment naïve iTB (19 are granulomas-positive), 50 patients with CD (8 are microscopic granuloma positive) and 19 controls (colonic mucosal biopsies from patients undergoing sigmoidoscopy for suspected hemorrhoidal bleed) were included. All samples were mucosal biopsies taken during colonoscopy/sigmoidoscopy at the index visit.
2. Definitions
1) Diagnosis of CD
The diagnosis of CD was made on the basis of the European Crohn's and Colitis Organisation guidelines, with a combination of clinical, endoscopic and histological features.21
Ethical clearance was obtained from the Institutional Ethics Committee for all experiments on archival human biopsy samples (IESC/T-22/2/03/2015 & for extension project IEC-304/2/06/2017). Informed consent was taken from all patients before taking biopsies for diagnostic purposes as per our routine protocol.
2) Diagnosis of iTB
The diagnosis of iTB was made in an appropriate clinical setting with the demonstration of necrotizing granulomas on histopathology or demonstration of AFB on histopathology or culture of intestinal tissue.22
3) Indeterminate Cases
In patients who did not fulfil the above definitions, therapeutic trial with antitubercular treatment (ATT) was given. Diagnosis of iTB was made if patient had clinical and endoscopic response to ATT, and diagnosis of CD was made if the patient showed no response, worsened or worsened after initial improvement with standard ATT and subsequently showed a clinical and/or endoscopic response to oral steroids/CD specific therapy.3
Histological examination was performed independently by 2 experienced pathologists, blinded about the detail of cases and the findings were finally corroborated.
3. Immunohistochemical Staining
Formalin fixed paraffin embedded blocks were retrieved and 4 µm thick sections were cut and were processed for immunohistochemical (IHC) stains as per the standard protocol. Dual color IHC staining was performed for the following combinations: rabbit polyclonal anti-human antibody against iNOS (Abcam, Cambridge, UK; 1:400)/goat anti-CD68 (Abcam; 1:400) as a marker of M1 macrophages, and mouse monoclonal anti-human Ab against CD163 (Abcam; 1:400)/goat anti-CD68 (Abcam; 1:400), as marker of M2 macrophages were used. Anti-rabbit/mouse alkaline phosphatase labeled secondary antibody (Spring Bio, Pleasanton, CA, USA) and peroxidase labeled universal secondary antibody (Spring Bio) were used for detection, using neutral red and di-amino benzidine (DAB) as substrates, respectively. The iNOS/CD68 and CD163/CD68 ratio were divided into 4 groups: 0, <1, 1–2 and >2 for the purpose of comparison. The percentages of M1 and M2 positive macrophages were assessed, out of the total CD68 positive macrophages in tissue sections and compared amongst the biopsies of iTB, CD and in controls.
4. In Vitro Culture of Macrophages for Validation
1) Isolation of PBMCs from Blood
Blood collected in the heparinized tube was diluted 1:1 with Dulbecco's phosphate-buffered saline (DPBS) and layered onto 15 mL of Histo-paque solution. After density gradient separation (1800 rpm, 30 minutes), a layer of peripheral blood mononuclear cells (PBMCs) was collected carefully. The PBMCs were washed twice with DPBS (1800 rpm, 10 minutes) and the cells were counted using hemocytometer. Calculated number of cells were panned for 3.5 hours on the adherent surface without any serum.
2) Maintenance and Differentiation of Isolated PBMCs
After panning, cells were washed twice with DPBS. The Roswell Park Memorial Institute (RPMI) media with serum (10%) and M-CSF (50 ng/mL) was added and incubated at 37℃, with 5% CO2. Cells were maintained in a tissue culture flask. Media change was given on the second day.
3) Activation of Monocyte-Derived Macrophages (MDM)
On the 6th day, the medium was discarded and the cells were washed with incomplete medium to remove traces of serum. The cells were detached using trypsinization. Following this, 0.3 mL of 0.25% trypsin solution was added to the cells and incubation was done for ~10 minutes in incubator (note: constant monitoring is important here to avoid over trypsinization of cells). Complete RPMI medium was added to the flask and the cells were flushed in order to detach the loosely adhering ones as well. The cell suspension was collected and centrifuged at 1800 rpm for 10 minutes. The resultant cell pellet was suspended in 500 µL of incomplete medium and cell counting was done. The cells were seeded in a 24 well plate at a density of 0.1 to 0.075 million cells per mL well. Two sets of conditions were applied: (1) untreated cells- where cells were maintained in complete medium and (2) IFN-γ treated (RPMI added at 100 U/mL) cells. Treatment was given for 24 hours.
4) JC-1 Staining of Treated Macrophages
The macrophages (supernatants removed in above section) were trypsinized and suspended in 500 µL phenol free RPMI with 10% fetal calf serum and were scraped. These cells were then collected in fresh Eppendorf tubes. The sample sets made were: unstained untreated, untreated JC-1 stained and IFN-γ treated JC-1 stained. Cell suspensions were centrifuged at 1800 rpm for 10 minutes. The supernatant was discarded. These cells were re-suspended in 200 µL of phenol free RPMI containing JC-1 stain (2 µM). The cells were vortexed and incubated at 37℃, 5% CO2 for 30 minutes. The cells were centrifuged at 1800 rpm for 10 minutes. The supernatant was discarded. The cells were re-suspended in 200 µL of DPBS and proceed for flow cytometry.
5. Statistical Analysis
Data analysis was done by SAS version 9.2 software (SAS institute Inc., Cary, NC, USA) and appropriate statistical methods were applied for comparison among groups.
RESULTS
1. Clinical Characteristics
Mean age±SD of patients with CD was 36.3±12.5 years, those with iTB was 32.5±12.0 years and in controls was 29.6±9.2 years. Two-thirds of both the diseases were mostly noted in the ileo-caecal junction, than in other parts of intestine. While 30% to 40% of granuloma-negative CD and iTB showed stricture, penetrating disease was seen in 7% of CD. On the other hand, 50% and 47% of granuloma-positive CD and iTB had stricture, and penetrating disease was noted in 5% of granuloma-positive iTB. All patients of iTB were treatment naïve and biopsies were taken, when anti tubercular therapy was yet to be started. In total 42.8% of granuloma-negative CD and 62.5% granuloma-positive CD got steroid therapy (Table 1).

Clinical and Histological Findings in Our Cohort (n=79)
2. Outcome of IHC Staining
While overall, 54.0% biopsies with CD and 20.7% biopsies with iTB showed positivity scores of 1 to 2, only 5.3% of the control biopsies included showed similar expression of M1φ (iNOS/CD68) (P=0.001). In comparison to the controls and iTB, in biopsies with CD, M1φ polarization was clearly in excess (P=0.0002 and P=0.002, respectively). In intestinal biopsies with iTB, M1φ marker expression was not significantly different from that of control biopsies (P=0.2) (Table 2, Fig. 1). On the other hand, marker for M2φ (CD163/CD68) did not show any significant polarity in CD or iTB, from that in control biopsies (Table 2, Fig. 1). Within the cases of CD included in this study, granuloma-positive CD showed <1 positivity score for for M1φ in 87.5% cases, in comparison to only 38.1% cases of granuloma-negative CD (P=0.02). Similar difference of expression was not noted with M2φ marker, between the granuloma-positive and granuloma-negative iTB (P=0.1) (Table 3). When all diseased biopsies were considered together, significant M1φ polarization was seen in granuloma-positive biopsies, than that in granuloma negative cases (P=0.0001) (Table 3). Similar pattern of expression was however not seen with M2 macrophage staining.
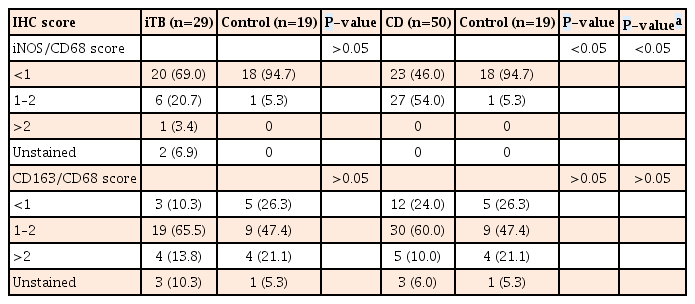
M1 (iNOS/CD68) and M2 (CD163/CD68) Macrophage Marker Scores in iTB, CD and in Controls

(A, B) Colonic biopsies showed more proinflammatory macrophages, than the light brown CD68 positive macrophages in CD (M1 macrophages-reddish brown, black arrows & CD68 positive macrophages, green arrows; A ×40; B ×100). (C) Figure shows confluent tubercular granulomas infiltrated by both M1 macrophages (inset, black arrows) and CD68 positive macrophages (green arrows) (×200). (D, E) Figures show iNOS/CD68 positive M1 macrophages in both superficial and deeper parts of mucosa (black arrows), as well as CD163/CD68 positive M2 macrophages (green arrows) in the deeper part of mucosa in CD (D, ×100; E, ×400). (F) Figure shows polarization of M2 macrophages in mucosal peri-cryptal granuloma of CD (green arrow) (×200).
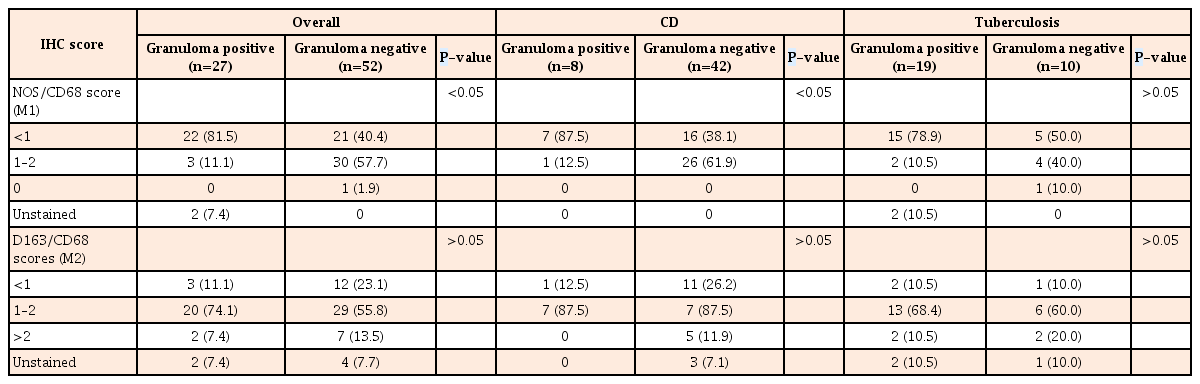
M1 (iNOS/CD68) and M2 (CD163/CD68) Macrophage Polarization Pattern in iTB and CD, with and without Granulomas, as well as in Controls
3. Higher Inflammatory Response in Monocyte-MDM from CD Patients, as Compared to iTB upon IFN-γ Treatment
To check if higher M1φ polarization in CD biopsies was due to the inherent property of monocytes to respond aggressively against inflammatory stimuli, we compared mitochondrial depolarization in macrophages derived from PBMCs of patients having CD and iTB upon IFN-γ treatment. PBMCs were isolated from the blood of both CD and iTB patients, and differentiated into macrophages in the presence of M-CSF. After 7 days of incubation, cells were treated with IFN-γ (100 U/mL) for 24 hours. We monitored mitochondrial membrane potential in control and IFN-γ treated cells using JC-1 staining. As shown in the figure (Fig. 2), we have 6 data points from 4 CD patients while 8 data points from 5 iTB patients. In general, we observed much more pronounced mitochondrial depolarization in MDMs isolated from CD patients, compared to those from iTB patients. While the statistical significance was at the border line, we believe a much larger comparison group would clearly distinguish the 2 groups in terms of IFN-γ treatment.

Peripheral blood mononuclear cells (PBMCs) from 5 CD and 8 intestinal tuberculosis (iTB) patients were differentiated into MDM's using M-CSF (50 ng/mL, 5–7 days). Differentiated macrophages were activated by interferon γ (IFN-γ; 100 U/mL, 12 hours) and stained with JC-1 dye (2 µM) before analyzing the samples in a flow cytometer. The ratio of mean fluorescence intensity in the red to that of green channel is plotted here for each sample. The differences were found significant using Mann-Whitney rank test (P<0.05). MDM, monocyte-derived macrophages; M-CSF, macrophage colony stimulation factors.
DISCUSSION
In this study, colonic biopsies from CD, iTB and control cases were subjected to IHC staining to see differential polarization pattern of M1φ and M2φ, if any. We noticed pro-inflammatory M1φ polarity both in biopsies of CD and iTB, in comparison to the controls. In comparison to iTB, in CD, the M1φ polarization was more. Furthermore, in biopsies showing histological granulomas, were also found to have more M1φ polarization, in comparison to biopsies without histological evidences of granulomas. The latter pattern was especially significant in biopsies from patients with CD than in iTB. On in vitro study, the mononuclear cell derived macrophages from both CD and iTB patients were stimulated with IFN-γ and macrophage membrane depolarization was assessed by JC-1 (mitochondrial membrane potential probe) dye, to validate our observation in human tissues. The in vitro results corroborated with the histopathology data as we observed heightened mitochondrial depolarization of macrophages from patients with CD, than in iTB, upon IFN-γ stimulation.
Though absolute specific phenotypical markers for M1 and M2 macrophages practically do not exist, various helpful markers have been identified, as CD38, Gpr18 and Fpr2 as novel M1 markers and Egr2, c-Myc as useful M2 markers. A CD38/Egr2-based flow cytometry assay is capable of distinguishing M1 and M2 macrophages efficiently,23 however, in tissues CD38 would have also expressed on differentiating B cells. Hence, in human intestinal biopsies, we chose to use iNOS for identifying the M1 macrophages, as it is highly expressed by M1φ. For identifying M2 macrophages we used a combination of CD163/CD68, though there are controversies that if CD163 alone can identify M2 macrophages specifically if CD163 is a marker of macrophages as a whole.24 CD163 is a scavenger receptor and is seen on macrophages in many organs, except splenic white pulps. However, in several studies CD163 had been used as a marker of M2 macrophages.2425 Our primary aim was to see the polarization pattern of M1 macrophages in CD, in comparison to iTB, hence, as a proof of concept study, we used these combinations. Differentiation of a macrophage-dendritic progenitor cell is dependant on the transcription factors as PU.1 and M-CSF.26 The M-CSF receptor is a tyrosine kinase transmembrane receptor, which on activation leads to receptor dimerization, autophosphorylation, PI3-kinase activation and eventually nuclear translocation of transcription factors. M-CSF mutant mice while showed reduced levels of circulating monocytes and selected macrophages; in human lack of M-CSF function leads to myelodysplastic syndrome or acute myeloid leukemia.1927 For in vitro study, we differentiated MDMs from peripheral blood mononuclear cells, collected from both CD and iTB patients, with the help of M-CSF, and then examined the macrophage membrane potential with JC-1 stain, by stimulating them with IFN-γ. Using this method for measuring the macrophage membrane potential for liposomes is time tested and reliable.28
In steady state, intestinal macrophages remain in M2 state, as identified by CD206 and CD163, which produce IL-10, IL-1β and transforming growth factor-β and help in proliferation of epithelial cells and proliferation of T-regulatory cells.26 Qualls and colleagues had shown that depletion of M2 macrophages in an experimental model, causes severe colitis, indicating antagonizing effects of M2 macrophages in intestinal inflammation.29 Tamoutounour and colleagues had demonstrated in a mouse model of T-cell mediated colitis that, the M1 type of pro-inflammatory macrophages become predominant after 12 hours of transfer and remain as the dominant cells till 3 weeks post-transfer. Whether the M2 macrophages, or the dendritic cells themselves can be converted into M1 type of cells during colitis is not known.30 Thiesen et al.31 had demonstrated more number of CD14 HLA-DR macrophages in inflammed colon in CD. Magnusson et al.,32 also noted a similar finding. Kamada et al.33 had identified CD14+CD33+ macrophages in CD, which secreted more IL-23 and TNF-α, on stimulation by Escherichia coli. Almost half of the colonic macrophages in CD was found to be CD14 positive. Ogino and colleagues observed CD14+ CD163low macrophages, which had properties similar as Th1 lymphocytes.34 Similar observations were also made in UC. Whereas in some study a M2 prominent macrophage pattern was noted in UC, in contrast to the CD,26 in a study by Lissner et al.,35 predominant proinflammatory M1φ reaction was noted in UC. In the latter study, in an in vitro co-culture model, the authors had demonstrated that the M1φ possibly causes apoptotic cell damage of the intestinal epithelial cells and increase trans-epithelial permeability, by altering the tight junction proteins.35 Another interesting fact is that in CD, the tissue infiltrating macrophages may have defective function, as a result E. coli strain have been demonstrated within macrophages in granuloma positive CD; which is usually not the fact in UC.36 Moreover, studies on macrophage polarization in iTB is sparse, hence, our primary objective to analyze the macrophage polarization pattern between CD and iTB was novel. A literature search revealed M2 macrophage polarization in lung TB by stimulating the WNT6 signaling pathway.37 It was noted that, M. tuberculosis secretes virulence factors such as lipo-arabinomannan and early secretory antigenic target-6, which inhibit M1 activation.38 However, in intestinal TB no such report is available.
As iNOS production is highly enhanced in M1 macrophages, our observations on biopsy and IHC were supported by the findings of in vitro analysis. As mentioned previously, use of CD163 alone as a marker of M2 macrophages is debatable. Being a scavenger receptor, it may reflect generalized macrophage activation. However, soluble CD163 in blood, cleaved from macrophage surface by matrix mettalo-proteases, also had been used as a marker of macrophage activation in literature.36 In a study by Jablonski et al.,39 the authors specifically addressed this issue and tried to identify most specific marker for M1 and M2 type of macrophages by comparative transcriptional analysis, followed by flow cytometry analysis. They noted that CD38 labeled 71% of M1 macrophages, Erg2 labeled 70% of the M2 macrophages. However, many more markers have been described in various studies as CD38, Gpr18 and Fpr2 as novel M1 markers and Egr2, c-Myc as useful M2 markers which show relative specificity. We acknowledge therefore that a more robust panel of markers could be used to conclusively rule out any enrichment pattern of M2 macrophages. Morever, this study also needs to be expanded to a wider number of samples in future. In iTB, while M1φ polarization, was definitely less than that in CD, overall, in granuloma-positive cases, M1φ polarization was significant, possibly indicating more severe intestinal pro-inflammatory change. In granuloma-positive CD, the clinical disease severity, number of recurrences, fistula formation, stricture, postsurgical complications are known to be more, than in the granuloma-negative CD. Looking at our observation, it appears that, due to more pro-inflammatory activity in intestine in granuloma-positive CD patients these complications are prevalent. This is one of the novel observations of this study. Due to the same reason, CD, as a whole appears to be a more notorious inflammatory lesion of intestine, than that of iTB, especially, in terms of chronicity and response to treatment concerned. We again highlight the fact that, while the M1φ was significantly more in granuloma-positive CD than the granuloma-negative CD, between granuloma-positive and negative iTB, similar difference was not seen. However, it is needed to be highlighted that, M2 macrophage numbers are also increased in both CD and iTB, than the controls (though not statistically significant). Classically M2 macrophages are considered necessary for development of fibrosis and wound healing. M2 macrophages, have also been shown to reduce the overall local intestinal immunity, leading to development of disease recurrence and opportunistic infections.3536
Hence, this study provides a preliminary insight on the fact that, M1φ are significantly polarized in intestinal mucosa of CD, then in iTB. M1φ polarization is further prominent in chronic intestinal inflammation with presence of granulomas. Since MDMs from CD showed heightened inflammatory response than those from iTB upon encountering inflammatory stimuli, the study also, albeit preliminarily, suggest inherent innate defense mechanism as the possible key player in the pathology of CD. This knowledge, not only enriches us regarding complex pathogenesis of intestinal inflammatory conditions, but also shows hope in using M1φ targeted therapeutic agents in near future. Presence of more pro-inflammatory M1φ in intestinal wall in granuloma-positive CD might explain the disease severity, recurrent, fistula, postsurgery complications already reported in this subset of CD.
Notes
FINANCIAL SUPPORT: This work was supported by the research grant of the Science & Engineering Research Board, affiliated to the Department of Science and Technology, Government of India (grant ID: EMR/2016/005296).
CONFLICT OF INTEREST: No potential conflict of interest relevant to this article was reported.
AUTHOR CONTRIBUTION: P.D., R.R., T.K., S.P., S.K., S.D.G., D.K., V.A. were actively involved in planning and execution of this study and writing this manuscript. S.U. & D.K. were responsible for in-vitro confirmation of M1 macrophage polarization from PBMCs. N.W. & I.K.A. were responsible for organizing the patient's samples and in laboratory analyses. P.D., S.K., S.D.G., D.K. & V.A. were also involved in critical analyses of the manuscript. V.A. is the overall guarantor of this article.


