
 KASID


Articles
- Page Path
- HOME > Intest Res > Volume 16(4); 2018 > Article
- Original Article Usefulness of fecal immunochemical test and fecal calprotectin for detection of active ulcerative colitis
- Dong Ju Kim1, Yoon Mi Jeoun2, Dong-won Lee1, Ja Seol Koo1, Sang Woo Lee1
-
Intestinal Research 2018;16(4):563-570.
DOI: https://doi.org/10.5217/ir.2018.00020
Published online: October 10, 2018
1Department of Internal Medicine, Korea University Ansan Hospital, Ansan, Korea
2Department of Psychology, Hwashin Cyber University, Busan, Korea
Correspondence to Ja Seol Koo, Department of Internal Medicine, Korea University Ansan Hospital, 123 Jeokgeum-ro, Danwon-gu, Ansan 15355, Korea. Tel: +82-31-412-4853, Fax: +82-31-412-5582, E-mail: jskoo@korea.ac.kr
• Received: February 12, 2018 • Revised: May 21, 2018 • Accepted: June 5, 2018
© Copyright 2018. Korean Association for the Study of Intestinal Diseases. All rights reserved.
This is an Open Access article distributed under the terms of the Creative Commons Attribution Non-Commercial License (http://creativecommons.org/licenses/by-nc/4.0/) which permits unrestricted non-commercial use, distribution, and reproduction in any medium, provided the original work is properly cited.


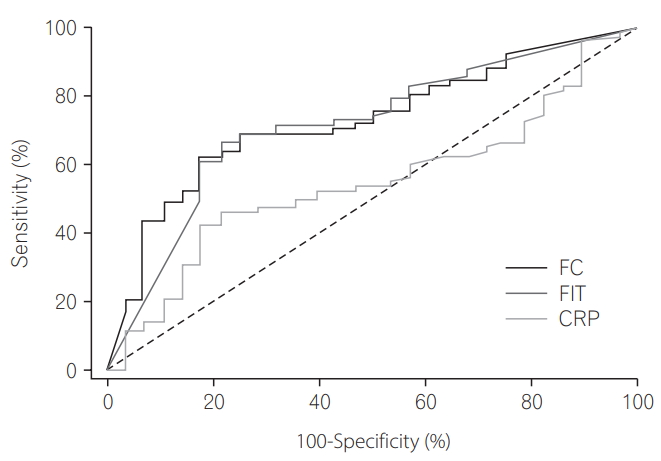
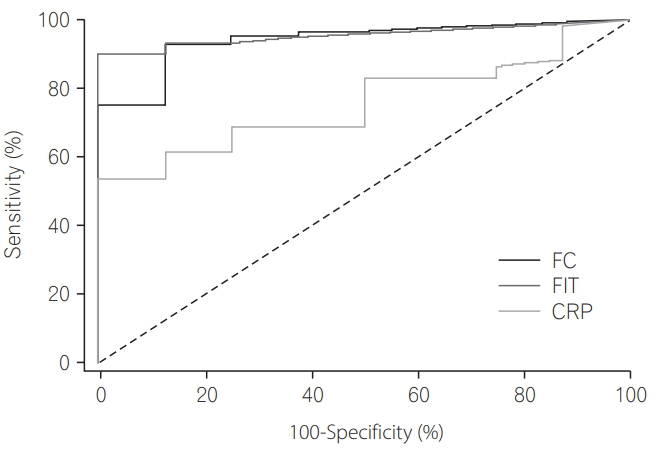
Figure & Data
REFERENCES
Citations
Citations to this article as recorded by 
- Predicting mucosal healing in patients with ulcerative colitis in clinical remission using biomarkers: A single-center prospective pilot study
Naohiro Kato, Ryusaku Kusunoki, Hiroki Kamada, Shigeaki Semba, Yuji Teraoka, Takeshi Mizumoto, Yuzuru Tamaru, Tsuyoshi Hatakeyama, Atsushi Yamaguchi, Hirotaka Kouno, Shigeto Yoshida, Toshio Kuwai
Medicine.2026; 105(7): e47536. CrossRef - Rapid and convenient electrochemical hemoglobin detection in mouse feces employing a DNA aptamer to evaluate the severity of colitis in a mouse model
Mizuki Nakashima, Daimei Miura, Erika Komiya, Nanami Watanabe, Kaori Tsukakoshi, Tsutomu Omatsu, Wakako Tsugawa, Koji Sode, Kazunori Ikebukuro, Toshinori Yoshida, Ryutaro Asano
Analytical Methods.2026; 18(19): 3924. CrossRef - Comparison of Changes in Biomarkers With Changes in Endoscopic Scores in Patients With Ulcerative Colitis: A Single‐Center, Retrospective, Observational Study
Yosuke Yamada, Natsuki Ishida, Tomohiro Takebe, Kenichi Takahashi, Yusuke Asai, Mihoko Yamade, Moriya Iwaizumi, Yasushi Hamaya, Takanori Yamada, Satoshi Osawa, Ken Sugimoto
JGH Open.2026;[Epub] CrossRef - Histologic features and predicting prognosis in ulcerative colitis patients with mild endoscopic activity
Seung Yong Shin, Hee Sung Kim, Kisung Kim, Chang Won Choi, Jung Min Moon, Jeong Wook Kim, Hyun Jin Joo, Jeongkuk Seo, Muhyeon Sung, Chang Hwan Choi
The Korean Journal of Internal Medicine.2024; 39(1): 68. CrossRef - Prostaglandin E‐major urinary metabolite diagnoses mucosal healing in patients with ulcerative colitis in remission phase
Toshiyuki Sakurai, Yoshihiro Akita, Haruna Miyashita, Ryosuke Miyazaki, Yuki Maruyama, Tomoko Saito, Mariko Shimada, Takuji Yamasaki, Seiji Arhihiro, Tomohiro Kato, Tomokazu Matsuura, Masahiro Ikegami, Isao Okayasu, Masayuki Saruta
Journal of Gastroenterology and Hepatology.2022; 37(5): 847. CrossRef - Alternative diagnoses and demographics associated with a raised quantitative faecal immunochemical test in symptomatic patients
Mark S Johnstone, Gillian Miller, Grace Pang, Paul Burton, Georgios Kourounis, Jack Winter, Emilia Crighton, David Mansouri, Paul Witherspoon, Karen Smith, Stephen T McSorley
Annals of Clinical Biochemistry: International Journal of Laboratory Medicine.2022; 59(4): 277. CrossRef - Correlation of fecal calprotectin and patient-reported outcome measures in patients with ulcerative colitis
Nagesh Kamat, Sudheer K Vuyyuru, Saurabh Kedia, Pabitra Sahu, Bhaskar Kante, Peeyush Kumar, Mukesh Kumar Ranjan, Mukesh Kumar Singh, Sambuddha Kumar, Vikas Sachdev, Govind Makharia, Vineet Ahuja
Intestinal Research.2022; 20(2): 269. CrossRef - Determining the usefulness of Capsule Scoring of Ulcerative Colitis in predicting relapse of inactive ulcerative colitis
Mao Matsubayashi, Taku Kobayashi, Shinji Okabayashi, Masaru Nakano, Shintaro Sagami, Ryo Ozaki, Hiroki Kiyohara, Hiromu Morikubo, Kunio Asonuma, Yusuke Miyatani, Shin Maeda, Toshifumi Hibi
Journal of Gastroenterology and Hepatology.2021; 36(4): 943. CrossRef - Biomarkers of Inflammation in Inflammatory Bowel Disease: How Long before Abandoning Single-Marker Approaches?
Gabriele Dragoni, Tommaso Innocenti, Andrea Galli
Digestive Diseases.2021; 39(3): 190. CrossRef - Biomarkers Predictive of Response to Thiopurine Therapy in Inflammatory Bowel Disease
Jack S. Cornish, Elisa Wirthgen, Jan Däbritz
Frontiers in Medicine.2020;[Epub] CrossRef - Predictive values of stool-based tests for mucosal healing among Taiwanese patients with ulcerative colitis: a retrospective cohort analysis
Hsu-Heng Yen, Mei-Wen Chen, Yu-Yao Chang, Hsuan-Yuan Huang, Tsui-Chun Hsu, Yang-Yuan Chen
PeerJ.2020; 8: e9537. CrossRef - What is the appropriate cut-off value of CRP to predict endoscopic remission in patients with ulcerative colitis in clinical remission?
Jongbeom Shin, Sung Min Kong, Gyeol Seong, Young-Ho Kim
International Journal of Colorectal Disease.2020; 35(12): 2249. CrossRef - Prostaglandin E-Major Urinary Metabolite Predicts Relapse in Patients With Ulcerative Colitis in Clinical Remission
Natsuki Ishida, Kiichi Sugiura, Takahiro Miyazu, Satoshi Tamura, Satoshi Suzuki, Shinya Tani, Mihoko Yamade, Moriya Iwaizumi, Yasushi Hamaya, Satoshi Osawa, Takahisa Furuta, Ken Sugimoto
Clinical and Translational Gastroenterology.2020; 11(12): e00289. CrossRef - Approaches to Integrating Biomarkers Into Clinical Trials and Care Pathways as Targets for the Treatment of Inflammatory Bowel Diseases
Parambir S. Dulai, Laurent Peyrin-Biroulet, Silvio Danese, Bruce E. Sands, Axel Dignass, Dan Turner, Gerassimos Mantzaris, Juergen Schölmerich, Jean-Yves Mary, Walter Reinisch, William J. Sandborn
Gastroenterology.2019; 157(4): 1032. CrossRef
 PubReader
 ePub Link
 Cite
 XML Download
Usefulness of fecal immunochemical test and fecal calprotectin for detection of active ulcerative colitis


Fig. 1. Receiver operating characteristic curves for fecal immunochemical test (FIT), fecal calprotectin (FC), and CRP levels, for use in determination of the diagnostic power of biomarkers for prediction of partial Mayo score >1.
Fig. 2. Receiver operating characteristic curves for fecal immunochemical test (FIT), fecal calprotectin (FC), and CRP levels for use in determination of the diagnostic power of biomarkers for prediction of Mayo endoscopic score ≥1.
Fig. 1.
Fig. 2.
Usefulness of fecal immunochemical test and fecal calprotectin for detection of active ulcerative colitis
| Variable | Total |
|---|---|
| Age (yr) | 46.3±16.7 |
| Male sex | 62 (58.5) |
| Current smoker | 8 (7.5) |
| Family history | 3 (2.8) |
| Fecal calprotectin (mg/kg) | 671±73.4 |
| FIT (ng/mL) | 485±461 |
| CRP (mg/dL) | 0.45±1.19 |
| Partial Mayo score | |
| Mild (2–4) | 52 (49.1) |
| Moderate (5–6) | 18 (16.9) |
| Severe (7–9) | 8 (7.5) |
| Endoscopic score | |
| Mild (1) | 42 (39.6) |
| Moderate (2) | 37 (34.9) |
| Severe (3) | 7 (6.6) |
| Disease location (Montreal classification) | |
| E1 | 34 (32.1) |
| E2 | 48 (45.3) |
| E3 | 24 (22.6) |
| Sensitivity (%) | Specificity (%) | Cutoff | |
|---|---|---|---|
| Fecal immunochemical test | |||
| Partial Mayo score (>4) | 96.2 | 62.5 | 258 |
| Partial Mayo score (>1) | 66.7 | 78.6 | 149 |
| Fecal calprotectin | |||
| Partial Mayo score (>4) | 88.5 | 62.5 | 350.7 |
| Partial Mayo score (>1) | 62.8 | 82.1 | 322.0 |
| Variable | No. (%) | AUC | SE |
95% CI |
|---|---|---|---|---|
| Positive group |
78 (73.58) | - | - | - |
| Negative group |
28 (26.42) | - | - | - |
| FC | - | 0.727 | 0.0533 | 0.632–0.809 |
| FIT | - | 0.717 | 0.0553 | 0.622–0.801 |
| CRP | - | 0.549 | 0.0605 | 0.450–0.646 |
| Difference between areas | SE |
95% CI | P-value |
|
|---|---|---|---|---|
| FC vs. FIT | 0.00962 | 0.0563 | –0.101 to 0.120 | 0.8643 |
| FC vs. CRP | 0.17800 | 0.0652 | 0.0499 to 0.305 | 0.0064 |
| FIT vs. CRP | 0.16800 | 0.0620 | 0.0465 to 0.290 | 0.0067 |
| Variable | No. (%) | AUC | SE |
95% CI |
|---|---|---|---|---|
| Positive group |
60 (88.24) | - | - | - |
| Negative group |
8 (11.76) | - | - | - |
| FC | - | 0.942 | 0.0341 | 0.857–0.984 |
| FIT | - | 0.956 | 0.0225 | 0.877–0.991 |
| CRP | - | 0.756 | 0.0682 | 0.637–0.852 |
| Difference between areas | SE |
95% CI | P-value |
|
|---|---|---|---|---|
| FC vs. FIT | 0.0146 | 0.0318 | –0.0478 to 0.0769 | 0.6466 |
| FC vs. CRP | 0.1850 | 0.0869 | 0.0152 to 0.3560 | 0.0328 |
| FIT vs. CRP | 0.2000 | 0.0781 | 0.0470 to 0.3530 | 0.0104 |
| Variable | B | SE | β | t | P-value | R2 | F | P-value |
|---|---|---|---|---|---|---|---|---|
| Constant | 0.909 | 0.141 | - | 6.45 | 0.000 | - | - | - |
| FIT | 0.001 | 0.000 | 0.554 | 5.40 | 0.000 | 0.307 | 29.21 | 0.000 |
| Constant | 1.050 | 0.135 | - | 7.78 | 0.000 | - | - | - |
| FC | 0.001 | 0.000 | 0.491 | 4.57 | 0.000 | 0.241 | 20.94 | 0.000 |
| Constant | 1.375 | 0.102 | - | 13.47 | 0.000 | - | - | - |
| CRP | 0.227 | 0.065 | 0.397 | 3.51 | 0.001 | 0.158 | 12.35 | 0.001 |
| Variable | B | β | t | P-value | R2 | ∆R2 | F | P-value |
|---|---|---|---|---|---|---|---|---|
| 1. FIT | 0.001 | 0.484 | 4.78 | 0.000 | 0.377 | 0.358 | 19.69 | 0.000 |
| CRP | 0.157 | 0.274 | 2.71 | 0.009 | ||||
| 2. FC | 0.000 | 0.394 | 3.43 | 0.001 | 0.287 | 0.265 | 13.07 | 0.000 |
| CRP | 0.135 | 0.235 | 2.04 | 0.045 |
| Variable | B | SE | β | t | P-value | R2 | F | P-value |
|---|---|---|---|---|---|---|---|---|
| Constant | 1.525 | 0.263 | 5.79 | 0.000 | ||||
| FIT | 0.003 | 0.000 | 0.551 | 6.72 | 0.000 | 0.303 | 45.28 | 0.000 |
| Constant | 1.720 | 0.248 | 6.95 | 0.000 | ||||
| FC | 0.002 | 0.000 | 0.536 | 6.45 | 0.000 | 0.287 | 41.81 | 0.000 |
| Constant | 2.636 | 0.227 | 11.62 | 0.000 | ||||
| CRP | 0.384 | 0.178 | 0.207 | 2.16 | 0.033 | 0.043 | 4.66 | 0.033 |
| Variable | B | β | t | P-value | R2 | ∆R2 | F | P-value |
|---|---|---|---|---|---|---|---|---|
| 1. FIT | 0.003 | 0.534 | 6.250 | 0.000 | 0.307 | 0.307 | 22.76 | 0.000 |
| CRP | 0.110 | 0.059 | 0.694 | 0.489 | ||||
| 2. FC | 0.002 | 0.540 | 5.936 | 0.000 | 0.287 | 0.287 | 20.71 | 0.000 |
| CRP | –0.022 | –0.012 | –0.131 | 0.896 |
Table 1. Baseline Demographic Variables of 106 UC Patients in This Study
Values are presented as mean±SD or number (%). FIT, fecal immunochemical test.
Table 2. Sensitivity, Specificity, and Cutoff Levels for Stool Markers, for Use in Determination of Their Diagnostic Power for Prediction of Partial Mayo Score
The unit is ng/mL. The unit is mg/kg.
Table 3. AUC of CRP, FIT, and FC (n=106)
DeLong ER, et al. [ Binomial exact. Partial Mayo score >1. Partial Mayo score 0 or 1. AUC, area under the curve; FIT, fecal immunochemical test; FC, fecal calprotectin; SE, standard error.
Table 4. Pairwise Comparison of ROC Curves
DeLong ER, et al. [ Significance level. ROC, receiver operator characteristic; SE, standard error; FC, fecal calprotectin; FIT, fecal immunochemical test.
Table 5. AUC of CRP, FIT, and FC (n=68)
DeLong ER, et al. [ Binomial exact. Mayo endoscopic score ≥1. Mayo endoscopic score 0. AUC, area under the curve; FIT, fecal immunochemical test; FC, fecal calprotectin; SE, standard error.
Table 6. Pairwise Comparison of ROC Curves
DeLong ER, et al. [ Significance level. ROC, receiver operator characteristic; SE, standard error; FC, fecal calprotectin; FIT, fecal immunochemical test.
Table 7. Simple Regression Analysis to Investigate the Effect of FIT, FC, and CRP on Mayo Endoscopic Score (n=68)
FIT, fecal immunochemical test; FC, fecal calprotectin; SE, standard error.
Table 8. Multiple Regression Analysis to Examine the Extent of Mayo Endoscopic Score Prediction Using FIT and CRP or FC and CRP (n=68)
FIT, fecal immunochemical test; FC, fecal calprotectin.
Table 9. Simple Regression Analysis to Investigate the Effect of FIT, FC, and CRP on Partial Mayo Score (n=106)
FIT, fecal immunochemical test; FC, fecal calprotectin; SE, standard error.
Table 10. Multiple Regression Analysis to Examine the Extent of Partial Mayo Score Prediction Using FIT and CRP or FC and CRP (n=106)
FIT, fecal immunochemical test; FC, fecal calprotectin.


