The effect of vitamin D administration on inflammatory markers in patients with inflammatory bowel disease
Article information

Abstract
Background/Aims
The exact relationship between vitamin D deficiency and inflammatory bowel disease (IBD) remains unclear. We evaluated the effect of vitamin D3 administration on inflammatory responses and disease severity in patients with IBD.
Methods
We investigated the serum 25-hydroxyvitamin D3 [25-(OH)D], C-reactive protein (CRP) levels and the partial Mayo score (PMS) in patients with IBD. Vitamin D3 was administered in patients with either vitamin D deficiency or insufficiency and CRP, serum vitamin D levels and PMS were re-examined at 6 months of administration.
Results
In 88 patients with Crohn’s disease (CD), a negative correlation was found between serum vitamin D and CRP. In 178 patients with ulcerative colitis (UC), serum vitamin D showed no association with CRP or PMS. Serum vitamin D increased from 11.08±3.63 to 22.69±6.11 ng/mL in 29 patients with CD and from 11.45±4.10 to 24.20±6.61 ng/mL in 41 patients with UC who received vitamin D3 treatment (P<0.001 and P<0.001, respectively). In patients with CD, median ΔCRP was –0.24 in the normalized vitamin D group and –0.11 in the non-normalized group (P=0.308). In patients with UC, median ΔCRP was −0.01 in the normalized vitamin D group and 0.06 in the non-normalized group (P=0.359).
Conclusions
Although a negative correlation was found between serum vitamin D and CRP levels in patients with CD, administration of vitamin D did not improve the CRP level in patients with CD. In patients with UC, serum vitamin D level was unrelated to CRP or PMS.
INTRODUCTION
Inflammatory bowel diseases (IBDs), such as CD and UC, are a group of chronic inflammatory diseases that display patterns of relapse and remission [1]. The pathogenesis of IBD is known to be associated with impaired immunity, gut microbiota, environmental factors, and genetic susceptibility [2].
Vitamin D is involved in the growth and maintenance of bones and in the metabolism of calcium and phosphorus. Moreover, vitamin D affects immune system function [3]. A recent meta-analysis showed that vitamin D levels are lower in patients with CD than in healthy individuals [4]. Patients with IBD in Korea have also been shown to have lower levels of vitamin D compared with healthy individuals [5]. In patients with IBD, vitamin D deficiency can occur due to a variety of causes such as inadequate oral intake of vitamin D, less exposure to sunshine, or reduced absorption after intestinal resection. However, whether vitamin D deficiency is a cause or a result of IBD is unclear [6].
There have been several studies on the relationship between vitamin D levels and the clinical outcome of patients with IBD. A small prospective study of patients with CD found an inverse association between disease activity and serum vitamin D levels [7]. Vitamin D and fecal calprotectin levels were found to be correlated in patients with IBD, but no association with CRP was observed [8]. Conversely, another study revealed no correlation between disease activity and serum vitamin D levels in patients with CD and UC [9]. In patients with CD, normalization of serum vitamin D levels resulted in a decrease in CRP [10]. There are various consequences to the development of IBD, disease activity, and levels of inflammatory markers. The exact relationship between vitamin D deficiency and IBD remains unclear.
The purpose of this study was to determine whether vitamin D is associated with CRP (a marker of systemic inflammatory response) and the partial Mayo score (PMS) and whether vitamin D administration can influence their values.
METHODS
1. Study Design
This study included patients with IBD treated at Seoul National University Bundang Hospital from January 2013 to June 2017. Their 25-hydroxyvitamin D3 [25-(OH)D] and CRP levels and PMS were investigated. Their age, sex, smoking status, IBD type, current medication, and laboratory data were also collected.
A total of 115 patients with CD were reviewed, of whom 27 without baseline CRP were excluded. Of the 88 baseline patients, 50 who did not have CRP or 25-(OH)D data at 6 months and 9 who did not need vitamin D supplementation were excluded. A total of 203 patients with UC were reviewed, of whom 25 without baseline CRP were excluded. Of the 178 baseline patients, 123 who did not have CRP, 25-(OH)D, or PMS data at 6 months and 14 who did not need vitamin D supplementation were excluded (Fig. 1).
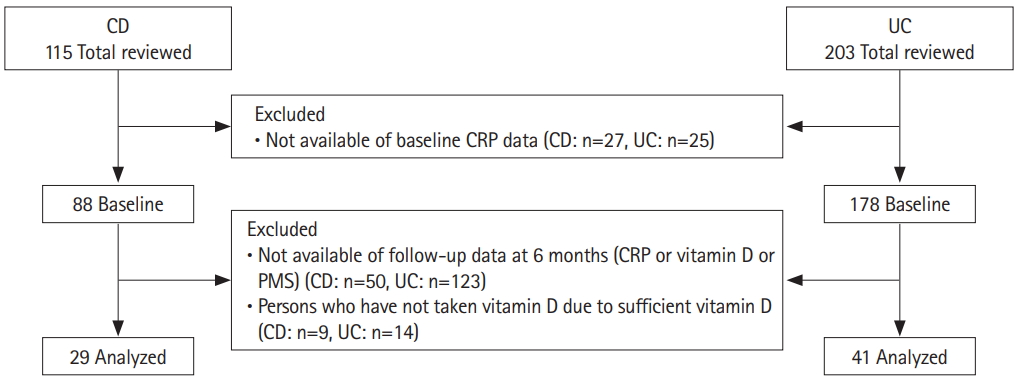
Flow diagram of patients with CD and UC.
Patients with vitamin D deficiency and insufficiency were instructed to take 1,000 or 500 IU of vitamin D3, once daily over 6 months, and those with 25-(OH)D, CRP, and PMS data available at 6 months of follow-up were included in the analysis. The initial dose of vitamin D was maintained, unless serum vitamin D reached 30 mg/mL. The differences in the measured variables between the start of vitamin D administration and the day of vitamin D measurement, which was within 1 month (before the patient was given vitamin D on that day), were analyzed. Without any other intervention, it was assumed that there would be no change in the serum vitamin D level within 1 month. Changes in serum vitamin D levels, CRP, and PMS were examined at 6 months after vitamin D3 administration and compared between patients who reached normal vitamin D levels and those who did not.
Liquid chromatography–tandem mass spectrometry was used to measure serum 25-(OH)D levels. Vitamin D insufficiency was defined as a 25-(OH)D level of 10 to 19 ng/mL (50–75 nmol/L), and more than 20 ng/mL was considered sufficient. A 25-(OH)D level lower than 10 ng/mL (50 nmol/L) was defined as vitamin D deficiency. The reference value of CRP was 0 to 0.5 mg/dL.
2. Endpoint
The primary endpoint was the reduction of inflammation and improvement of the disease activity index after vitamin D administration.
3. Statistical Analysis
SPSS version 22.0 (IBM Corp., Armonk, NY, USA) and Graph-Pad Prism version 5.01 (GraphPad Software, La Jolla, CA, USA) were used for the statistical analyses. We performed Spearman correlation analysis to determine whether vitamin D is associated with CRP levels or PMS in patients with IBD. In patients with IBD, serum vitamin D levels according to the Montreal classification were compared using the Kruskal-Wallis test because the data did not meet normal distribution. The Mann-Whitney test was used to compare serum vitamin D levels according to medication use. A paired t-test was used to compare serum vitamin D levels before and after the administration of vitamin D3. The Mann-Whitney U-test was performed to compare ΔCRP, and ΔPMS between the groups in which vitamin D was elevated above normal and those in which it was not. Δ25-(OH)D between the normalized vitamin D group and the non-normalized group was analyzed by Student t-test. Seasonal serum 25-(OH)D changes were analyzed using the Kruskal-Wallis test because the data did not show normal distribution. The post-hoc analysis was done using the Mann-Whitney U-test and the significance level was measured using the Bonferroni method. We used a t-test to compare age, sex, smoking status, vitamin D, CRP, and current medication use in patients with CD and UC.
4. Ethical Statement
The Institutional Review Board of Seoul National University Bundang Hospital approved this study (IRB No. B-1707-409-109). The requirement for informed consent was waived because of the retrospective nature of the study.
RESULTS
1. Patient Characteristics
The present study included a total of 266 patients with IBD (88 with CD and 178 with UC). Table 1 shows the baseline characteristics of all patients with IBD.

Clinical Characteristics of the 266 Patients with IBD
2. Seasonal Variation of Vitamin D
The serum 25-(OH)D levels of 266 patients with IBD were analyzed according to season. Seasonal median vitamin D levels were the lowest in winter (11.95 ng/mL), followed by spring (12.30 ng/mL), summer (14.20 ng/mL), and autumn (16.15 ng/mL). The Kruskal-Wallis test demonstrated a significant difference between autumn and spring (P<0.001), between summer and winter (P=0.004), and between autumn and winter (P<0.001) (Fig. 2).
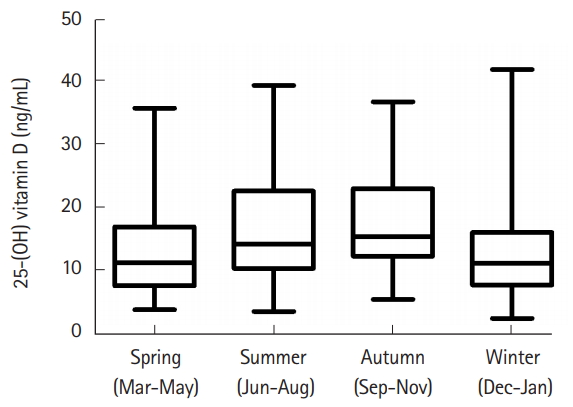
Seasonal variation of 25-(OH) vitamin D in 266 IBD patients. Difference between autumn and spring (P<0.001), between summer and winter (P=0.004), and between autumn and winter (P<0.001).
3. Comparison between the Montreal Classification and Medication Use with Serum Vitamin D in Patients with IBD
There were no statistically significant differences in serum vitamin D levels in each category of Montreal age (P=0.634), location (P=0.137), and behavior (P=0.081) in patients with CD. There was no statistically significant difference in serum vitamin D levels between Montreal extents in UC patients (P=0.685).
In patients with CD, serum vitamin D levels were different between corticosteroid-treated and non-treated patients (P=0.045). There was no statistically significant difference in serum vitamin D levels in CD patients irrespective of whether 5-aminosalicylates (P=0.785), immunomodulator (P=0.688), and anti-TNF (P=0.288) were used. In patients with UC, there was no statistically significant difference in serum vitamin D levels with or without all of the medications mentioned above (5-aminosalicylates, P=0.224; corticosteroid, P=0.740; immunomodulator, P=0.233; anti-TNF, P=0.982).
4. Correlation between CRP or PMS and Vitamin D in Patients with IBD
Serum vitamin D showed a negative correlation with CRP in patients with CD (rho =–0.259, P=0.015; 95% CI, –0.427 to –0.078). However, no correlation with CRP (rho=0.001, P=0.991; 95% CI, –0.162 to 0.161) or PMS (rho=–0.073, P=0.331; 95% CI, –0.215 to 0.066) was observed in patients with UC (Fig. 3).

Correlation between 25-(OH) vitamin D and CRP in patients with (A) CD (n=88) or (B) UC (n=178) (CD, P=0.015; UC, P=0.991).
5. Comparison before and after Vitamin D Administration
Patients who had received vitamin D3 and had available follow-up 25-(OH)D, CRP, and PMS data at 6 months were analyzed. The analysis included 41 patients with UC and 29 with CD (Table 2). We gave 1,000 or 500 IU of vitamin D3 once a day to patients with vitamin D deficiency and insufficiency.

Clinical Characteristics of the 70 Patients with IBD Who Had Received Vitamin D3 and Had Available Follow-up 25-(OH) Vitamin D, CRP, and Partial Mayo Score Data at 6 Months
After vitamin D3 treatment, serum 25-(OH)D increased from 11.08±3.63 to 22.69±6.11 ng/mL in patients with CD (P<0.001) and from 11.45 ±4.10 to 24.20 ±6.61 ng/mL in patients with UC (P<0.001). A daily intake of 1,000 IU of vitamin D3 for 1 month increased serum vitamin D by 3.65 ±2.38 in patients with CD and 4.10 ± 3.28 in those with UC. The extent of serum vitamin D elevation was not different between the 2 treatment groups (P=0.530) (Fig. 4).

Serum 25-(OH) vitamin D level before and after vitamin D administration in patients with (A) CD (n=29) or (B) UC (n=41) (CD, 11.08±3.63→22.69±6.11 ng/mL, P<0.001; UC, 11.45±4.10→24.20±6.61 ng/mL, P<0.001).
6. Comparison of the Groups with or without Above Normal Vitamin D
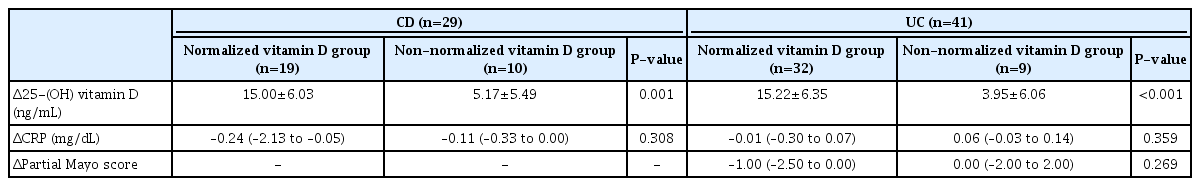
In patients with CD, The median of the ΔCRP was –0.24 in the group with a normalized serum 25-(OH)D level and −0.11 in the non-normalized group (P=0.308). In patients with UC, there was no statistically significant difference in ΔCRP between groups with a normalized serum 25-(OH)D level and those without. The median (interquartile range) of the ΔPMS was −1.00 (−2.50 to 0.00) in the group with a normalized serum vitamin D level and 0.00 (−2.00 to 2.00) in the non-normalized group, which was not a statistically significantly difference (Table 3).
DISCUSSION
Lower levels of vitamin D are associated with a poor disease course and greater disease activity in patients with CD [11]. Several studies have investigated the association between vitamin D levels and inflammatory markers and disease activity, but the results have been inconsistent [12,13]. In most studies, there was an inverse correlation between vitamin D levels and CDAI and CRP levels [6,13]. However, other studies failed to show a correlation [14,15].
In patients with CD, our study showed that vitamin D levels and CRP were negatively correlated. However, vitamin D administration did not reduce CRP, even with an increase in serum vitamin D. CRP and PMS were not associated with vitamin D level, and vitamin D administration did not improve CRP levels in patients with UC.
A previous study of 33 patients with CD showed that serum vitamin D levels were related to CRP as a systemic marker [16]. However, another study reported no correlation in 37 patients [13]. In our study, a relatively large number of patients with CD (n=88) were examined, demonstrating a weak negative correlation between serum 25-(OH)D levels and CRP.
The serum 25-(OH)D levels increased after daily administration of 1,000 IU vitamin D for 1 month in both patients with CD (by 3.65 ± 2.38 ng/mL) and with UC (by 4.10 ± 3.28 ng/mL). The increase was not significantly different when compared between the 2 disease groups. This result can be used to determine the required dose and duration of vitamin D supplementation to increase serum 25-(OH)D levels effectively in patients with IBD. Another study has shown that serum 25-(OH)D increases by 91.6 nmol/L (36.7 ng/mL) after intake of 2,000 IU/day of vitamin D for 3 months [17]. However, since exposure to UV B changes based on the latitude and season [18], the extent of vitamin elevation would be expected to vary between studies. The CRP decrease after vitamin D administration was more pronounced in the normalized vitamin D group than in the non-normalized group, but the difference was not statistically significant. These results support the notion that vitamin D deficiency may be a secondary consequence rather than a cause in patients with CD.
In 29 patients with CD who were administered vitamin D, the average serum 25-(OH)D level increased from 11.45 ± 4.10 to 24.20 ± 6.61 ng/mL. We considered a vitamin D level over 20 ng/mL to be normal, on the basis of the criteria of the World Health Organization [19] and the Institute of Medicine [20]. However, in some studies, the normal level of vitamin D was defined as greater than 30 ng/mL [10,21]. Yang et al. [22] reported that the CDAI score improved when the serum vitamin D level exceeded 100 nmol/L (30 ng/mL). In our study, there were few patients with vitamin D levels exceeding 30 ng/mL (13%). Therefore, it is possible that there was no improvement in inflammatory markers. Debate persists on the minimum acceptable level of vitamin D, and further research is needed to determine the optimal level. In addition, because the baseline CRP levels of patients with IBD in this study were not high, it was difficult to statistically validate their degree of improvement after vitamin D administration.
Endoscopic evaluation of disease activity has been considered to be a superior approach to clinically assessing the severity of disease and mucosal inflammation in CD compared with the conventional clinical indices (CDAI, Harvey-Bradshaw index) and CRP. One study reported that the Simple Endoscopic Score for CD showed an inverse correlation with vitamin D in hospitalized patients with CD. We did not measure the Simple Endoscopic Score for CD in our study, but investigating whether it improves after vitamin D supplementation will help determine the efficacy, or lack thereof of supplementation. Our patient population was examined in the outpatient setting, and their disease severity was relatively low; therefore, this may have precluded us from detecting the previously reported inverse correlation between serum 25-(OH)D and CRP [23].
Vitamin D is ingested through food or is synthesized by the action of UV light on the skin. The UV index is stronger in coastal areas than inland, in the countryside than in the city, and in summer than in winter. We analyzed the vitamin D levels according to season before supplementation and found them to be lowest in winter and highest in autumn, but there was no significant difference between summer and autumn. Latitude, amount of outdoor activity, skin color, and exposure to sunshine influence vitamin D synthesis. In the winter, fewer UV rays lead to lower vitamin D levels in both the patients and the healthy population [24,25].
This study has several limitations. First, there were no CDAI data, as this was a retrospective study using hospital electronic medical records. The CDAI score was irregularly measured and hence could not be used for this study. Second, the sample size was small because there were only a few patients in whom vitamin D and CRP levels and PMS were all measured regularly. A large randomized, prospective controlled study is needed to clarify the results. Third, CRP levels may be influenced not only by vitamin D but also by various other factors such as therapeutic agents, which were not analyzed. Fourth, we did not check vitamin D supplementation compliance. However, in view of the fact that serum vitamin D was elevated in the supplemented group, it is likely that there were no major problems with the compliance.
In conclusion, although a negative correlation was found between serum vitamin D and CRP level in patients with CD, administration of vitamin D did not improve the CRP level in such patients. In patients with UC, serum vitamin D level was unrelated to CRP or PMS.
Notes
FINANCIAL SUPPORT
The authors received no financial support for the research, authorship, and/or publication of this article.
CONFLICT OF INTEREST
No potential conflict of interest relevant to this article was reported.
AUTHOR CONTRIBUTION
Jun JC collected and analyzed the data, and wrote the paper. Yoon H designed the study protocol and supervised the writing of the paper. Choi YJ, Shin CM, Park YS, Kim N, Lee DH, Kim JS critically reviewed the paper. Approval of final manuscript: all authors.