


INTRODUCTION
The existing histological classification systems for assessment of duodenal mucosal changes in celiac disease (CeD) include original Marsh classification, modified Marsh classification [1,2], Corrazza and Villanacci classification (2005), and Ensari (2010) classification. Because of the qualitative nature of the parameters included in all the above classification system, there are low interobserver agreements amongst pathologists in most of the parameters except for the intraepithelial lymphocyte (IEL) count [3-6]. The lowest interobserver agreement has been observed in differentiating the modified Marsh grades 3a and 3b with these classification systems [5]. Apart from the visual microscopic assessment techniques, quantitative histological assessment (Q-histology) of intestinal mucosa has gained acceptance in the recent past [7-10]. Although the Q-histology was introduced in the 1970s, their use, however, remained limited to the research settings only [11]. Even with this limited use, the Q-histology assessment technique evolved over a period of time and became more straightforward from older methods of measuring the mucosal surface to volume ratio, mucosal index (mucosal height to length of muscularis mucosa) assessment [12] and computer card based drawing technique [8] to a more simplified recent protocol of using the villous height (Vh) to crypt depth (Cd) ratio [9]. However, despite its acceptance and simplification, Q-histology has yet not become the standard for clinical care. One of the reasons being a lack of a well defined Q-histological classification system based on quantifiable histology parameters [13].
The primary objective of this study was to develop an objective Q-histological classification system for assessing the mucosal changes in the duodenal biopsies from patients with CeD.
METHODS
1. Ethics Statement
All study procedures were approved by the Institutional Ethical Committee (IEC/NP-312/2012 & RP-07/2012, dated October 10, 2012) and performed in the study were by the ethical standards of the institutional research committee and with the 1964 Helsinki declaration and its later amendments or comparable ethical standards. Informed consent was obtained from the subjects included in this study.
2. Derivation Cohort
Duodenal biopsies from 137 controls including those with functional dyspepsia (n=50), subjects undergoing endoscopic retrograde cholangiopancreatography for common bile duct stone(s), as well as carriers of HBV infection were included. All of them underwent appropriate workup for the exclusion of any organic disease. All of them had negative IgA-anti-tissue transglutaminase antibody (anti-tTG Ab) titers and had normal endoscopic findings. Duodenal biopsies from 124 adult patients with CeD diagnosed as per the European Society of Pediatric Gastroenterology, Hepatology and Nutrition 2012 criteria, were also included [14]. During the execution of this work as anti-tTG Ab ELISA kits from different manufacturers were used; for uniformity, we derived anti-tTG antibody fold rise value, as the (tTG value in a patient ÷ normal cutoff value for that particular ELISA kit). During endoscopic examination, 4 to 6 mucosal biopsy fragments were obtained from the post-ampulla part of the duodenum.
3. Identifcation of Quantitative Histological Parameters for Diferentiation between Duodenal Biopsies from Controls and Patients with CeD
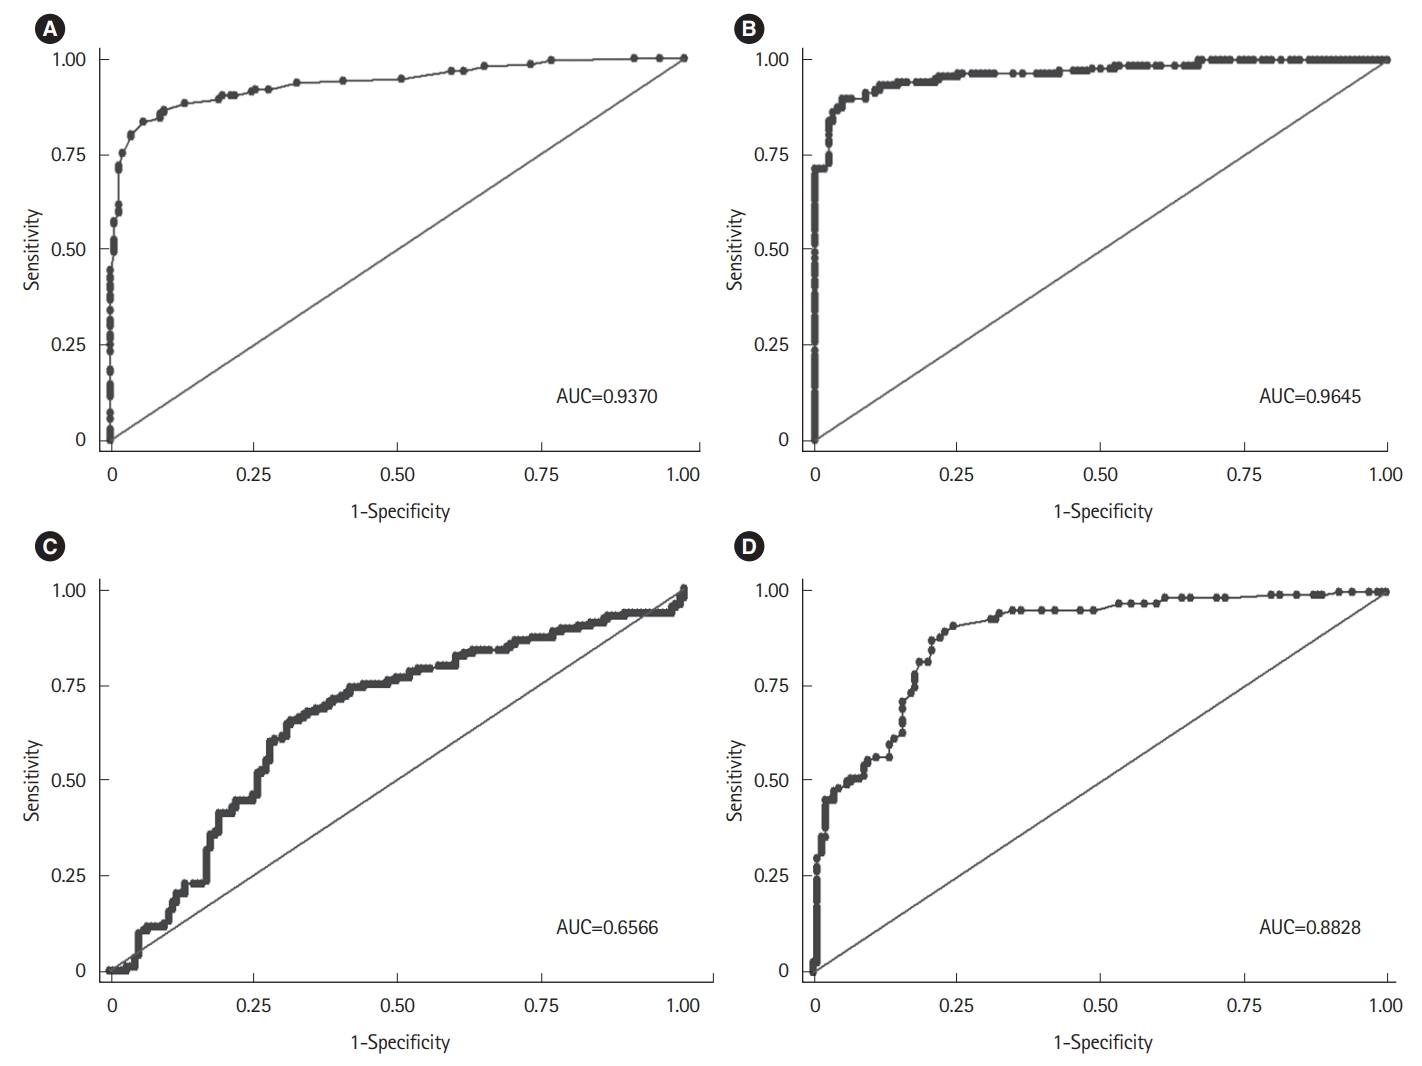
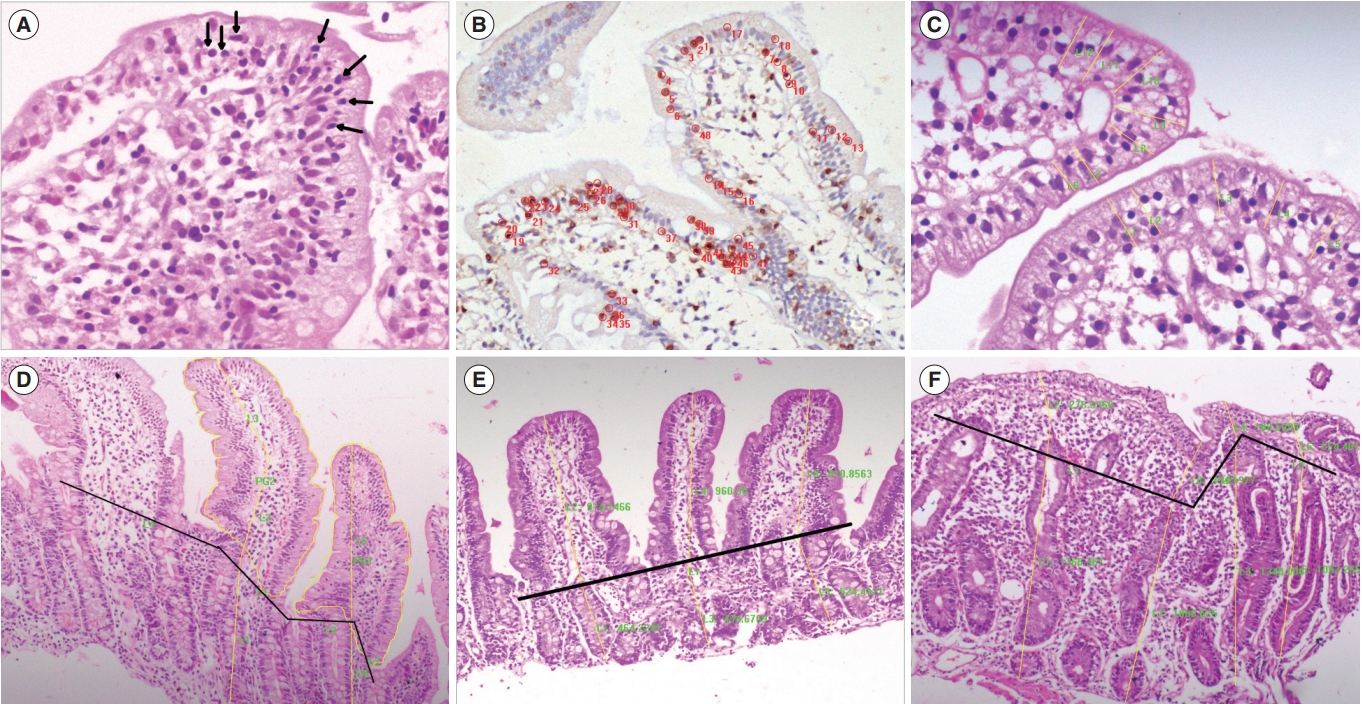
Digitized images of duodenal biopsies were analyzed by a pre-calibrated (in micrometer scale) computer assisted image analysis (CIA) technique based software supplied by the Media Cybernetics, version 6.1 (Rockville, MD, USA). The following parameters were measured in the oriented part of biopsy fragments: Vh, Cd, epithelial cell height (Eh) at the villous tip, villous area and number of IELs/100 epithelial cells (ECs) at the villous tip. The Q-histological assessment was performed on an average of 4 mucosal biopsy fragments from each subject, including at least 5 to 15 villi (depending on the biopsy orientation). CD3 staining of the IELs was done for uniformity by using the rabbit anti-human CD3 antibody (Spring Biosciences, Pleasanton, CA, US; 1:200) and was detected by a polymer-based secondary detection kit (DAKO, Carpinteria, CA, USA). The stained IELs were counted by using the manual tagging tool of the software and expressed as the number of IELs/100 ECs, after counting at least 2,000 ECs in the upper one-third of villi. The Vh and Cd were measured by using the distance measuring tool and the average Cd to Vh ratio was calculated. The histological parameters which can differentiate a biopsy from patients with CeD and controls were identified by receiver operating curve (ROC) analysis (Table 1) followed by multivariate and logistic regression analyses (Figs 1, 2). Principal investigators (P.D. and A.S.) performed the CIA-based analyses in the derivation cohort in a blinded manner.
4. Reprodicibility Assessment of the Quantitative Histological Parameters
We then recruited a new set of validation cohort including biopsies from 120 patients with CeD and 105 controls. The Q-histological parameters found relevant in the derivation cohort were assessed in the validation cohort (Table 2).
5. Formation of a New Quantitative Histological Classification
A new Q-histological classification system for assessment of duodenal biopsies was derived based on the parameters which were found significant in both derivation and validation cohorts in differentiating mucosal biopsies from patients with CeD and controls (Table 3).
6. Validation of the New Quantitative Histological Classification System
The diagnostic sensitivity and specificity of proposed Q-histology classification were examined both in the derivation and validation cohorts separately, with and without using the anti-tTG antibody titers.
Intraobserver and interobserver validation: 4 qualified histopathologists (G.P.G., M.R., G.K., and A.N.), who were not involved in the derivation process, participated in the validation process in a blinded manner. A set of randomly selected 50 digitized histological slides of duodenal biopsies, including both controls and patients with CeD were handed over for Q-histological reporting using the CIA-based software. The participants were allotted different time slots on a single desktop computer to exclude technical bias. Each observer performed quantitative analysis twice, keeping a gap of 2 weeks in-between. Between the 2 cycles, the chronology of the digitized slides was altered. They were also asked to perform light microscopic grading of biopsies separately using the modified Marsh Oberhuber classification, original Marsh classification, Corrazza and Villanacci classification, and Ensari classifications in both the occasions. The interobserver and intraobserver agreements among the observers were estimated and were compared with those with the existing light microscopic classifications.
7. Statistical Analysis
A Stata 11 software (StataCorp LP, College Station, TX, USA) was used. The mean±SD of all parameters was calculated separately. For identifying histological parameters with good discriminative power, 2-sample t-test with equal variances was used, followed by 2-sample Wilcoxon signed-rank sum (Mann-Whitney) test. Diagnostic sensitivity and specificities of each parameter were calculated by ROC analysis, followed by univariate and multivariate analyses. Logistic regression analysis was performed with the calculation of OR and 95% CIs for each parameter. The intraobserver and interobserver variations were analyzed using McNemar’s test and weighted kappa analyses. A P-value <0.05 was taken as statistically significant.
RESULTS
1. Characteristics of Subjects Included in the Derivation Cohort
In the derivation cohort, duodenal biopsies from 261 subjects including 137 adult controls (mean age 32±10.9 years, males 108) and 124 adult patients with CeD (mean age 26.5±13.5 years, males 93) were included. The anti-tTG antibody fold in the control group and patients with CeD were 0.4±0.6 and 8.5±8, respectively.
2. Quantifiable Histological Parameters Assessed in the Derivation Cohort
1) IEL Counting
The IEL count in duodenal biopsies from patients with CeD was higher than that in controls (45.9±19.9 vs. 13.4±8.1, P< 0.001). IEL count ≥25/100 ECs was found to optimally differentiate between biopsies from patients with CeD and control with 88% sensitivity and 87% specificity (AUC, 93.7%; 95% CI, 91%-96%) (Table 1, Fig. 1). When the cutoff of IEL increased to ≥30/100 ECs (as per the Marsh classification), the sensitivity reduced to 83%, and specificity increased to 94%. When the IEL cutoff was considered as ≥40/100 ECs, the sensitivity dropped to only 56%, but specificity increased to 99%. The odds of a suspected case being CeD was 49.3 (P<0.001) if the IEL count was ≥25 IEL/100 ECs (Table 1, Fig. 1).
2) Villous Height
Vh was significantly lower in patients with CeD, than in control biopsies (484±212 μm [170-1,520 μm] vs. 2,108±81 μm [366-3,880 μm], P<0.001). As determined by the ROC analysis, Vh cutoff <335 μm was found to have good discriminative power between the duodenal biopsies of patients with CeD and controls (sensitivity and specificity of 91% each [AUC 96.4%]) (Fig 1). The odds of a suspected case to have CeD was 97.1 (95% CI, 41.8-225.7; P<0.001), if Vh was <335 μm (Table 1).
3) Crypt Depth
There was no significant difference in the Cd in the mucosal biopsies obtained from controls and patients with CeD (255± 124 μm [range, 108-865 μm] vs. 238±86 μm [range, 75-490 μm], P=0.09) (Table 1).
4) Cd to Vh Ratio
The mean Cd to Vh ratio in controls was 0.56±0.45 (range, 0.25-5.08) in comparison to 1.45±1.3 (range, 0.32-12.1) in patients with CeD (P<0.001). Using the Cd:Vh ratio cutoff >0.5 (1:2), the biopsies from controls and patients were classified correctly with a sensitivity of 95.1% and specificity of 53.3%. A Cd:Vh ratio cutoff ≥0.66 (1:1.5) identified from the ROC analysis showed the highest sensitivity of 81% and specificity of 80% (AUC 88%) (Fig. 1). As the lowest estimated Cd:Vh in the control group of biopsies was 0.25, we then examined the discriminative power of Cd:Vh >0.25 (1:4); while the sensitivity reached to 100%, specificity became nil. Our next objective was to examine the discriminative power of Cd:Vh >0.33 (1:3), as was described in the Marsh classification. With this cutoff, biopsies from patients with CeD and controls were classified with 99% sensitivity, but specificity was only 11%. Hence, the highest discriminative sensitivity and specificity was noticed when the pathological cutoff of Cd:Vh considered ≥0.5 (1:2) (Fig. 1).
5) Surface Eh
Mucosal Eh was 37±6.4 μm (range, 18-58 μm) in biopsies from patients with CeD and 35±1.9 μm (range, 17-177 μm) in controls (P<0.001). On ROC analysis, Eh of ≥35.4 μm was found to have a low discriminative power in differentiating biopsies from controls and that of patients with CeD (sensitivity, 63%; specificity, 60%; AUC, 66.1% [95% CI, 59%-72%]; OR, 2.55) (Table 1).
6) Villous Area
Duodenal biopsies from patients with CeD were found to have short and stubby villi with a higher overall villous area (943.15±436.2 μm2), in comparison to the biopsies from controls (829.5±745.5 μm2) (P=0.007). Villous area ≥750 μm2 was found to discriminate biopsies from patients with CeD and controls with a sensitivity and specificity of 66% each, AUC 65.6%, and odds of a suspected case having CeD was 3.94 (P<0.001) (Table 1, Fig. 1).
3. Assessment of Quantifiable Histological Parameters in a Validation Cohort
The CIA-based Q-histological analyses were repeated in a validation cohort including duodenal biopsies from 225 subjects including 105 controls (mean age, 33.8±9.6 years) and 120 patients with CeD (mean age, 28.5±12 years) to re-check the reproducibility of the histological parameters (Tables 1, 2). While, the pathological cutoffs for the Eh and villous area differed widely (cutoff of Eh and cutoff of villous area in derivation cohort were ≥35.4 μm and ≥750 μm2; cutoff of Eh and cutoff of villous area in validation cohort were ≥29 μm and <1,330 μm2, respectively), rest of the histological parameters, as Vh, Cd, Cd:Vd correlated well between these cohorts (Tables 1, 2).
4. Univariate and Multivariate Analysis of the Q-Histological Parameters
Based on univariate analysis of the results of the derivation cohort parameters such as IEL count ≥25/100 ECs, Vh <335 μm, Cd:Vh ratio ≥0.66, villous area ≥750 μm2 and mucosal Eh of ≥35.4 μm were found to be significant in the differentiation of duodenal mucosal biopsies from controls and patients with CeD with sensitivity and specificity of 62.9% and 90.4%, respectively (Table 1). Of these, only 3 parameters, namely Vh <335 μm, IEL count ≥25/100 ECs, and Cd:Vh ratio ≥0.66, were found statistically significant on multivariable analysis. Finally, these 3 histological parameters were chosen for inclusion in the Q-histology based classification.
5. Logistic Regression Analysis of the Q-Histological Parameters
Based on the coefficients of logistic regression analysis, a histological scoring system was formulated to check their utility for differentiationg duodenal biopsies from patients with CeD and controls. The scoring system was as follows:
( IEL count ≥25/100 ECs×3.9)+(Vh <335 μm×4.8)+(Cd:Vh ratio ≥0.66×2.9)
Total score varied from 0 to 11. This scoring system was then re-applied on the raw data of derivation cohort including duodenal biopsies from 261 subjects. A score of ≥6, was found to discriminate the duodenal biopsies from patients with CeD and controls with a sensitivity of 90.3% (83.7%-94.9%), specificity of 93.5% (87.7%-97.2%), positive predictive value (PPV) 93.3% (87.3%-97.1%), negative predictive value 90.6% (84.2%-95.1%) and AUC 96.2%. In controls, the score was <6 (P< 0.001). These 3 Q-histological parameters together showed an area under ROC of 97.4% for discriminating between duodenal mucosal biopsies from patients with CeD and controls.
6. Modification of Histological Parameters to Exclude Technical Confounding Factors
While measuring the length between 2 points with the CIA-based software takes into account pixel density per inch, the pixel resolution of the camera sensor or the computer screen used for image analyses can alter the outcome. Hence, we decided to use a single camera for digitization and one computer terminal for CIA-based analysis. However, as these factors can vary among different set-ups, we modified the absolute cutoff value for Vh to Vh fold change by dividing the mean Vh in duodenal biopsies from patients by the average Vh in control biopsies. The IEL counting was based on manual tagging tool of the software, and the Cd:Vh ratio required no further adjustment. Hence, finally, the following modified histological parameters were incorporated in the proposed Q-histological classification system: IEL count ≥25/100 ECs, adjusted Vh fold change ≤0.7, Cd:Vh ratio ≥0.5.
7. Proposition of a Q-Histological Classification System
Based on the above mentioned adjusted parameters, we propose a new Q-histological classification system for classifying the changes in duodenal biopsies. We classified the biopsies to be normal (type 0) if IELs count is <25/100 ECs. We classified abnormalities in the biopsies as follows: type 1 or early enteropathic changes: IEL count ≥25/100 ECs with normal Vh fold change >0.7 and Cd:Vh ratio <0.5; type 2 or intermediate enteropathic changes: IEL count ≥25/100 ECs along with abnormality of any one of the other 2 Q-histology parameters, such as the Vh fold change ≤0.7 ‘OR’ the Cd:Vh ratio ≥0.5; type 3 or advanced enteropathic changes: IEL count ≥25/100 ECs along with Vh fold change ≤0.7, as well as the Cd:Vh ratio ≥0.5 (Table 3, Fig. 2).
8. Validation of the Newly Proposed Q-histological Classification System
The newly proposed Q-histological classification was reapplied on the raw data files of the derivation and validation cohorts separately. Based on the defined criteria, of 323 duodenal biopsies in the derivation cohort, 142 (43.9%) were classified as Q-histology type 0 (including 120 controls and 22 from patients with CeD), 11 (3.4%) as Q-histology type 1 (including 7 controls and 4 from patients with CeD), 131 (40.5%) as Q-histology type 2 (including 10 controls and 121 from patients with CeD) and 39 (12.07%) as Q-histology type 3 (including 1 control and 38 from patients with CeD). The sensitivity and specificities of the Q-histology type 1, type 2 and type 3 changes were as follows: type 1: 15.4% and 94.5%, which when combined with the anti-tTG Ab data became 16.7% and 99.2%; type 2: 84.6% and 92.3%, which when combined with tTG fold rise value became 82.1% and 99.2%; type 3: 63.3% and 99.2%, which when combined with tTG value became 64.3% and 100%, respectively. When both the serum tTG titre was high (both anti-tTG fold rise value >1 and >10 times above normal were considered separately) and either type 1, type 2 or type 3 Q-histological changes, none of the biopsies from patients with CeD was wrongly classified as biopsies from controls.
Of duodenal biopsies from 225 patients in the validation cohort (105 controls and 120 CeD), 108 biopsies (47.7%) were classified as Q-histology type 0 (all were from controls), 6 (2.6%) as Q-histology type 1 (all 6 were biopsies from patients with CeD), 33 (14.6%) as Q-histology type 2 (all from patients with CeD), and 78 biopsies (34.9%) as Q-histology type 3 (all from patients with CeD). When both Q-histology and serum tTG titres (both anti-tTG fold rise values >1 and >10 were considered) were abnormal, none of the disease biopsies were classified as controls in the validation cohort. When both serum anti-tTG titre was normal and Q-histology was 0, none of the biopsies were classified as biopsies from CeD. In 3 biopsies from patients with CeD, despite being serum anti-tTG titre high, Q-histology type was 0. Similarly, in 18 control duodenal biopsies with normal serum anti-tTG titer Q-histology analysis showed type 1 changes. Overall sensitivities and specificities of Q-histology type 1, type 2 and type 3 changes for diagnosing CeD were 66.7% and 100%; 91.7% and 100%; 96.3%, and 100%, respectively. Adding the tTG fold rise values did not alter these sensitivities and specificities further. Overall PPV of Q-histology type 2 changes were 92.6% and 100% in the derivation, and in validation cohorts respectively. All these findings show that Q-histological type 2 and 3 changes have good sensitivities, specificities as well as PPV in identifying abnormal intestinal biopsies, which become further specific for CeD when correlated with serum tTG values.
9. Reproducibility Assessment of the Q-Histology Classification System
The proposed Q-histology classification system showed the highest intraobserver agreement (69.7%-85.0%) and interobserver agreement (24.6%-71.5%) in comparison to other existing histological classification systems (Table 4).
DISCUSSION
After analyzing duodenal biopsies from 486 subjects including both controls and patients with CeD, we found that IEL count ≥25/100 ECs, Vh fold change ≤0.7, Cd:Vh ratio ≥0.5 are most reliable Q-histological parameters which can differentiate duodenal biopsies from patients with CeD and controls. The sensitivity, specificity, and PPV of the Q-histological classification system and better interobserver and intraobserver agreements suggest that Q-histology based classification is a better method for the assessment and documentation of duodenal mucosal biopsies [15-18]. We typed the duodenal mucosal histological changes based on the presence or absence of Q-histological parameters, as early enteropathy changes (type 1), intermediate enteropathy changes (type 2) and advanced enteropathy changes (type 3). This typing method of duodenal histological changes was however not based on the severity of Q-histological parameters, as that does not have any impact on patient management and the changes may not follow a steady pattern in reality. In this Q-histology classification system, the type 1 change only corresponds to increased IELs at villous tips; while in type 2 and type 3 changes, there will be either change in Vh or Vh:Cd or both. This way of graded typing of the histological changes will increase the likelihood of identifying the diseases biopsies more confidently, as we have seen in this study for diagnosing CeD [19-25]. Though, we performed CD3 immunostaining for highlighting the IELs (Fig 2B); in routine, it is not essential [25]. An experienced pathologist can identify the IELs and nuclei of ECs differently and can count easily. The other included parameters as Vh and Cd:Vh can either be measured by eye-piece reticules or with CIA-based software, more easily than previously described quantitation methods, as villous tortuosity and villous area [26,27], and spatiotemporal mucosal changes by in-vivo capsule endoscopy [3,8,9,28].
The Q-histology may prove to be better than the existing qualitative classification systems because it includes quantifiable histological parameters, hence can generate reliable and comparable data among research groups from different geographical regions and its ability to provide uniformity in the interpretation. As a long time is required for visual appreciation of histological improvement on the qualitative scale, another potential application of the Q-histology based classification system is likely to be assessment of even minor changes in the histology that occur over a shorter period of time especially during clinical trial of newer drugs such as as latiglutenase, zonulin inhibitors, therapeutic vaccines, etc [29]. Applicability of the modified Marsh classification is not optimum for interpreting follow-up biopsies from patients with CeD on GFD, because visible changes in Vh or Cd:Vh are slow to take place and minor changes are difficult to determine visually. Q-histology in such scenario can accurately measure any improvement or deterioration of Vh or Cd:Vh, which can be compared with baseline biopsy data. The outcome of the Q-histology assessment would depend on the exclusion of the possible confounding factors, such as the technical expertise of operators, adequacy of sampling, biopsy orientation, pixel densities of the digital camera sensor and the computer screen [29-33]. Also, the Q-histological assessment may be more labor intensive than the visual light microscopic analysis. While the light microscopic evaluation with use of eye-piece reticule takes around 5 minutes, the CIA-based assessment may take approximately 20 minutes for analyzing a digitized slide. We took care of the possible confounding factors and tried to justify why despite being more labor intensive Q-histology can be valuable.
While there is a merit of this study, there exits a few limitations. Recruitment of entirely healthy subjects for the derivation of normative histological characteristics was not ethically justifiable, and hence we recruited subjects with functional dyspepsia, HBV carriers and patients undergoing endoscopic retrograde cholangiopancreatography as controls.
In conclusion, this study demonstrates that the Q-histological assessment of duodenal biopsy can bring uniformity and reliability in the histological evaluation of mucosal alterations in patients with CeD. The Q-histology classification system has a potential for its use in clinical practice and in assessing histological response over a short period as required in many ongoing clinical trials.