


INTRODUCTION
Ulcerative colitis (UC) is an incurable chronic disease that commonly develops at young ages and lasts throughout life, impacting quality of life. Although a recent systematic review showed that more than 80% of studies from high prevalence regions such as North America and Western Europe reported a plateau or decreased incidence of UC, the prevalence of UC remains high. In contrast, a low prevalence region, such as Asia, which has newly industrialized countries, is facing increasing incidence [1]. Therefore, changing the epidemiology of UC in the next decade will challenge health care systems worldwide.
The burden of UC varies in different countries and populations. Although UC is not associated with an increased risk of mortality [2], it is associated with high morbidity [3]. Because of the complex and incurable nature of the disease, understanding the natural history of UC is important to prepare health care resources and policies for this chronic and costly disease. A systematic review of the natural history of UC that included several studies from high incidence countries reported that approximately 50% of patients with UC required corticosteroids at 10 years, the rate of UC-related hospitalization at 10 years was 50%, and the rate of colectomy at 10 years was 10% to 15% [3]. However, long-term studies from low incidence countries are lacking. In Asia-Pacific region, Thailand had the lowest incidence of UC (crude incidence of 0.28 per 100,000 persons) [4].
Hence, we aimed to evaluate the natural history of adult UC in a low incidence area and changes of disease course regarding the rates of endoscopic healing, hospitalization and colectomy between 2000 and 2018.
METHODS
1. Study Setting and Study Population
We conducted a retrospective study in 2 university hospitals (Siriraj Hospital and King Chulalongkorn Memorial Hospital) from Bangkok, Thailand. All patients were required to meet the diagnosis criteria of UC on the basis of clinical symptoms, diffusely granular or friable colonic mucosa, and continuous mucosal involvement based on endoscopy and histology [2,5]. We excluded UC patients who were diagnosed from outside our institutes. Cases were included only for the remaining UC diagnosis at 6 months after the first date of diagnosis. Infections, intestinal tuberculosis, amoebiasis, and drug-induced colitis were excluded. The index date was based on the first UC diagnosis. The medical records of patients with UC were retrospectively reviewed from the date of first UC diagnosis until the end of the study (December 31, 2018) by 2 experts (S.A. and J.L.). The study protocol was approved by the ethics committees of each institute (Chulalongkorn IRB No. 398/53 and Siriraj IRB No. 710/2561). The informed consent was waived.
2. Treatment Strategy
In our practice, the treatment strategy is based on a step-up approach. For mild to moderate disease activity, mesalamine (topical and/or oral) is prescribed as induction and maintenance. For severe disease activity, systemic corticosteroids are prescribed. Thiopurine is prescribed for steroid-dependent UC. Biologic agents are prescribed for steroid refractory or steroid dependent with thiopurine nonresponsive/intolerant. During the study period, infliximab and vedolizumab are available for UC indication in Thailand. According to the Food and Drug Administration of Thailand, infliximab has been approved since 2003 and vedolizumab has been approved since 2017. Infliximab was able to be reimbursed since 2009. The criteria for reimbursement of infliximab are steroid refractory or steroid dependent with thiopurine nonresponsive/intolerant. Nowadays, vedolizumab is non-reimbursable. Colectomy is considered for severe UC refractory to medical treatment. Colectomy in UC patients is only performed at our institutes. Patients with induction therapy are followed up every 1-2 months and patients with maintenance therapy are followed up every 3-6 months at the inflammatory bowel disease clinic in our institutes. Endoscopic assessment is performed within a 6- to 12-month interval after treatment initiation.
3. Data Collection
At UC diagnosis, data on demographic characteristics, smoking status, symptom duration before diagnosis, and disease extent were collected. During the follow-up period, data on endoscopic healing, UC-related hospitalization and colectomy were collected. Data regarding UC treatment was collected as follows: (1) ever used oral mesalamine; (2) ever used combined topical and oral mesalamine; (3) ever used systemic corticosteroid; (4) ever used thiopurine and date of initiation; (5) ever used biologic agent and date of initiation; (6) at least one hospital admission more than 24 hours and date of first admission; and (7) colectomy and date of first colonic resection. We defined requiring systemic corticosteroid, biologic agent, and colectomy due to medical failure as markers of disease severity. The extent of disease was defined according to the Montreal classification as proctitis (E1), left-sided colitis (E2) and extensive colitis (E3). We defined mucosal healing as Mayo endoscopic subscores (0-1).
4. Statistical Analysis
The chi-square or Fisher exact test was used for 2 proportions of data comparison. Independent t-tests or the Mann-Whitney U test was used for 2 continuous data comparison. To assess changes in the disease course of UC, we stratified patients into 2 cohorts: (1) 2000-2009 cohort-patients with UC diagnosis during the calendar year of 2000-2009 and (2) 2010-2018 cohort-patients with UC diagnosis during the calendar year of 2010-2018. The cumulative probability of endoscopic healing, UC-related hospitalization and colectomy was estimated using the Kaplan-Meier method. The log-rank test was used to compare the disease course of UC between the 2 cohorts. Cox proportional hazards analyses were used to assess association between baseline factors (sex, age < 40 years at diagnosis, body mass index, smoker, extensive colitis, extraintestinal manifestation and calendar period of UC diagnosis) and time from UC diagnosis to first event of achieving endoscopic healing, UC-related hospitalization, and colectomy expressed in hazard ratio (HR) with 95% confidence interval (CI). We included variables with a P<0.1 in the univariate analysis in the multivariate analysis model. We considered statistically significant as an alpha level of 0.05. Statistical analyses were performed by using SPSS Statistics version 23.0 (IBM Corp., Armonk, NY, USA).
RESULTS
1. Patient Characteristics
A total of 291 patients with UC (119 patients diagnosed in 2000-2009 and 172 patients diagnosed in 2010-2018) were followed for total of 2,228 person-years. The median follow-up duration in 2000-2009 cohort was 10 years (interquartile range [IQR], 7-13 years) and 4 years (IQR, 2-7 years) in 2010-2018 cohort. The median age at UC diagnosis was 42 years (IQR, 32-55 years), and 53% of patients were female. There were nonsmokers (n = 261, 90%), former smokers (n = 27, 9%) and active smokers (n = 3, 1%). Twelve patients (4%) underwent appendectomy. None of the patients had a family history of inflammatory bowel disease. At diagnosis, the disease extent was distributed as E1 (n = 62, 21%), E2 (n = 103, 35%), and E3 (n = 126, 43%). During study period, 23 (14%) patients with either E1or E2 at diagnosis had disease progression to E3. Eighty-one (68%) patients in the 2000-2009 cohort and 112 (65%) patients in the 2010-2018 cohort experienced severe disease (P=0.60). There was no difference in patient characteristics between 2 cohorts (Table 1).
2. Medications
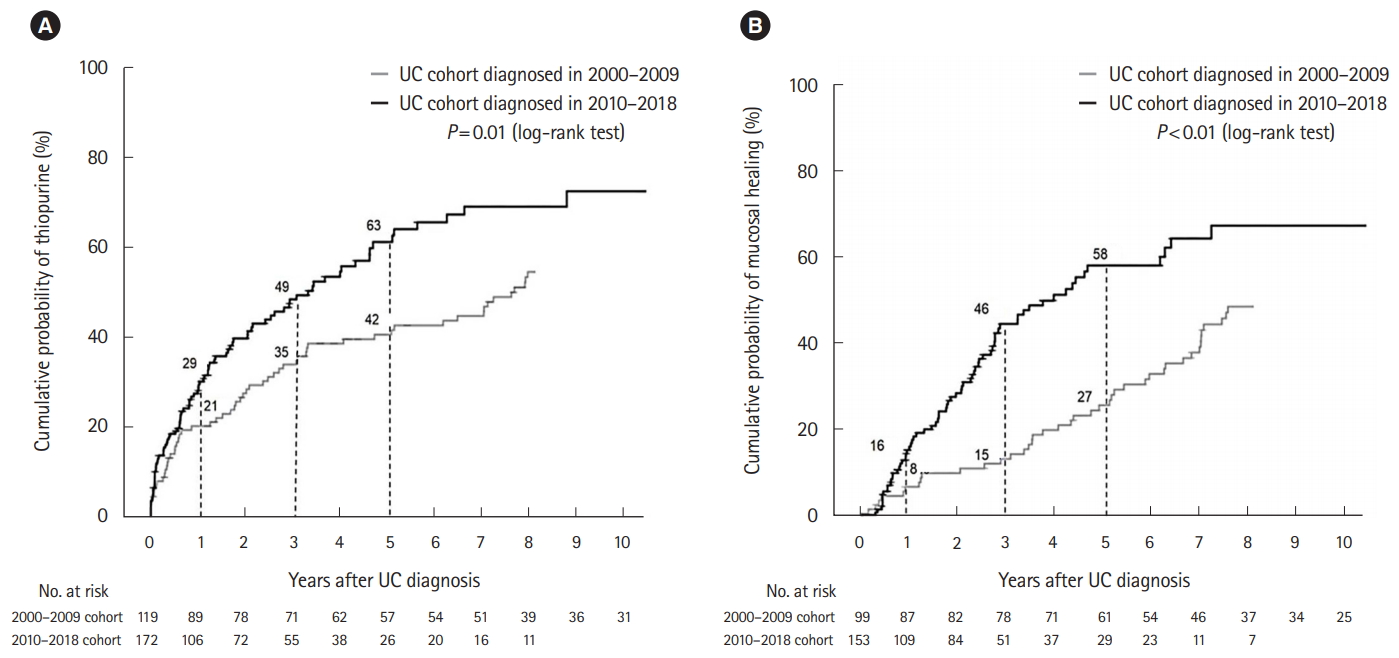
Comparing between the 2 cohorts, the use of combination treatment of oral and topical mesalamine in the 2010-2018 cohort (49%) significantly increased when compared with the use in the 2000-2009 cohort (29%, P<0.05). For systemic corticosteroids, there was no difference in any use of corticosteroids between the 2 cohorts (63% vs. 64%, P=0.87). For thiopurine use, a significant increase in the use of thiopurine between the 2 cohorts was observed. The median duration from diagnosis to thiopurine initiation in the 2000-2009 cohort was 24 months and 11 months in the 2010-2018 cohort (P<0.01). The cumulative probability of receiving thiopurine was 21% versus 29% at 1 year and 35% versus 49% at 3 years and 42% versus 63% at 5 years after diagnosis between the 2000-2009 cohort and the 2010-2018 cohort (P=0.01) (Fig. 1A). Only 3 patients in the 2000-2009 cohort and 1 patient in the 2010-2018 cohort required biologic agents. The cumulative probability of receiving biologic agents was 1% at 5 years after diagnosis for both cohorts.
3. Endoscopic Healing
A total of 252 patients with UC underwent endoscopic evaluation after treatment. There was a significant increase in the mucosal healing rate between the 2 cohorts. The cumulative probability of achieving mucosal healing was 8% versus 16% at 1 year, 15% versus 46% at 3 years and 27% versus 58% at 5 years after diagnosis between the 2000-2009 cohort and the 2010-2018 cohort (P<0.01) (Fig. 1B). Table 2 shows the Cox proportional hazards analysis models for the association of baseline factors and the risk of achieving endoscopic healing. In multivariate analysis, a decreased risk of achieving endoscopic healing was observed in patients with age < 40 years at diagnosis (adjusted HR [aHR], 0.69; 95% CI, 0.48-1.00) and those with UC diagnosis in 2000-2009 (aHR, 0.54; 95% CI, 0.37-0.79).
4. Hospitalization
Among 291 patients with UC, 62 patients (21%) required at least one hospitalization at some point during the disease course (33 patients from the 2000-2009 cohort and 29 patients from the 2010-2018 cohort). There was a significant decrease in the rate of UC-related hospitalization in the 2010-2018 cohort when compared with those in the 2000-2009 cohort (P<0.05). The cumulative probability of requiring UC-related hospitalization was 18% versus 5% at 1 year, 28% versus 12% at 3 years, and 30% versus 21% at 5 years in the 2000-2009 and 2010-2018 cohorts (P=0.048) (Fig. 2A). Table 3 shows the Cox proportional hazards analysis models for the association of baseline factors and the requirement of UC-related hospitalization. In multivariate analysis, patients with extensive colitis (aHR, 2.82; 95% CI, 1.66-4.82) and those with UC diagnosis in 2000-2009 (aHR, 1.70; 95% CI, 1.03-2.81) were significantly associated with developing UC-related hospitalization.
5. Colectomy
Sixteen of 291 patients with UC underwent colectomy at maximal follow-up of the study (11 from the 2000-2009 cohort due to medical failure [n = 8], superimposed severe cytomegalovirus colitis [n = 2], high-grade dysplasia of colon [n = 1] and 5 from the 2010-2018 cohort due to medical failure [n = 5]). The rate of colectomy in the 2010-2018 cohort significantly decreased when compared with the 2000-2009 cohort (P<0.05). The cumulative probability for colectomy at 5 years after diagnosis was 6% in the 2000-2009 cohort and 2% in the 2010-2018 cohort (P=0.04) (Fig. 2B). In multivariate analysis, although not statistically significant, the risk of colectomy was also found in patients with extensive colitis (aHR, 1.96; 95% CI, 0.69-5.51) and those with UC diagnosis in 2000-2009 (aHR, 2.81; 95% CI, 0.92-8.61) (Table 3).
DISCUSSION
In the present study, we observed that the patient’s characteristics and the disease extension at diagnosis of UC remained stable over time. There was a less aggressive disease course of UC. Approximately, 60% of patients had E1/E2 and about 14% of those patients developed E3 on follow-up. Although twothirds of patients experienced active disease that required systemic corticosteroid during their disease course, approximately the overall 5-year cumulative risk of requiring hospitalization was 25% and the overall 5-year cumulative risk of colectomy was 5%. These rates have been declined over time that corresponds with an increase in the use of thiopurine (63%), but not biologic use (1%).
There was no sex difference in our study population. Our findings are in line with a pooled analysis of incidence from Western studies [6]. The disease locations of UC in our study were generally similar to those in the Western [3,7], Australian [4], and Asian populations [4]. However, the overall rate of progression to extensive colitis was 14%, which was comparable to the Asia population (12%) [8] but less than that in the Copenhagen study (28%) [9]. In addition, the overall rate of requiring corticosteroid use in our study was approximately 63%, which was relatively less than that in the Sweden study (71%) [7].
The paradigm shifts in UC management such as early initiation of thiopurine and treatment target for endoscopic remission during the two decades were observed. We found a significantly increased proportion of patients with UC diagnosed in the 2010s who received more combinations of oral and topical mesalamine. The shorter time to initiate thiopurine after diagnosis and the proportion of thiopurine users has significantly increased during two decades. In the 2000s, approximately 20% of patients with UC used thiopurine in the first year after diagnosis and increased to 30% of patients with UC in the 2010s. This is in accordance with Dutch study, where there was a 2- to 3-fold increased thiopurine user from 8% in 1991-1997 to 23% in 1998-2006 [10]. For biologic agents, we did not find the changes in the use of biologic agent in our population. The overall biologic agent use was only 1% for both the 2000s and 2010s in our population. In contrast, an increase in the first year use of biologic agent (5%-10%) was found more in the West population [9-11]. A Canadian cohort in 2014 reported that the cumulative incidence of biologic agent use within 5 years of diagnosis was 7.8% [12]. This may explain by the disease course in our population, which was less severity, and then was able to control inflammation with conventional treatment. Regarding endoscopic remission, we demonstrated the significantly increased proportions of mucosal healing during two decades. The cumulative probability for achieving endoscopic healing within 3 years of the disease course was 15% in the 2000s and increased to 46% in the 2010s.
We found that the evolution of UC management, including the use of a combination of oral and topical mesalamine [13], early use of thiopurine [14] and treat-to-target strategy [15], may play role on the changes long-term disease outcomes. The UC-related hospitalization and colectomy rates in our population were lower than those in the West [3]. We also demonstrated a reduction rate of UC-related hospitalization and colectomy over the past two decades. Between the 2000s and 2010s, the 5-year cumulative probabilities for UC-related hospitalization decreased from 30% to 21% and for colectomy decreased from 6% to 2%. A recent systemic review of Western studies showed that the 5-year cumulative probability of requiring UC-related hospitalization was 29% to 54%, and the colectomy rate at 5 years of disease was 10% [3].
There have been no population-based data about the change of UC incidence over time from Thailand, and other countries in Southeast Asia. A hospital-based registry study from Malaysia demonstrated the crude UC incidence in 1980s was 0.3 per 100,000 and increased to 0.9 per 100,000 in 2010-2018 [16]. Disease emergence in developing countries suggests that changing epidemiological trends are related to westernized lifestyle and industrialization. A population-based study from the AsiaPacific region revealed that a high-density population was more likely to develop UC [17]. Thus, in the 21st century, UC is becoming a burden disease across Asia [1]. Our results may help a newly industrialized country with a low incidence of UC with further investigations regarding environmental determinants of UC development, planning for a local health care strategy to modify the disease course of UC, and providing comprehensive information about disease prognosis to a patient for making a treatment decision.
A strength of this study is that all patients were meticulously longitudinally reviewed by 2 experts rather than relying on administrative data. All incident patients were followed from disease onset until the end of the study period. However, this study has several limitations. First limitation is a retrospective nature of the study; any data not recorded in the medical records would have been missed. Second, this study is a hospital-based study. Therefore, our patients would have more severe disease than these from a population-based study. We estimated the natural history of UC would be less aggressive in the national level. Third, changes in disease extent and endoscopic healing may not be accurate. Endoscopic evaluation was not performed routinely for all patients. In our practice, we generally perform endoscopic assessment in patient with flare-up disease. For patients with active disease, we usually perform endoscopic assessment every 6-12 months. Fourth, we did not classify disease activity according to disease activity indexes such as Mayo scores. Because disease course of UC is dynamic from disease in remission to severe disease over time, adjustment for the activity of disease would have been complicated. Fifth, we did not perform the analysis on time to initiation treatment of mesalamine and systemic corticosteroids. Certain therapies, most notably mesalamine was prescribed as an initial treatment for mild to moderate disease activity whereas systemic corticosteroid was prescribed as an initial treatment for severe disease activity. However, our study allows for an assessment of ever used of combination oral and topical of mesalamine and ever used of systemic corticosteroid in UC patients. Last, the ethnic diversity in Bangkok was less than in the Asia region. Therefore, these results would limit the generalization to the country with more diverse ethnicities.
In conclusion, the disease course of UC in Thailand was less aggressive in term of the rates of systemic corticosteroid use, biologic use, colectomy and UC-related hospitalization than in the West. Over the two decades, the rates of UC-related hospitalization and colectomy have been decreasing which were similar to the West.