


INTRODUCTION
As per global tuberculosis (TB) report, extrapulmonary TB (EPTB) accounted for 16% of the 7.1 million incident reported cases of TB in 2019 [1], with a gradual increase in the proportion of EPTB cases over the years. Abdominal TB, considered the sixth most common form of EPTB, comprises about 6%-11% of the extrapulmonary cases [2], and can involve the peritoneum, intestines, solid organs or lymph nodes. Intestinal TB (ITB) is the commonest form of abdominal TB and can involve almost any area of the bowel with the ileocecal region being the most commonly affected site [3]. Crohn’s disease (CD), a form of inflammatory bowel disease (IBD) has seen a global increase in disease burden in recent years [4], mostly due to compounding prevalence in the West, and increasing incidence in the developing world. It can cause transmural inflammation in any part of the gut from the mouth to the anal canal. Like ITB, the most common site of involvement is the ileocecal region.
Both ITB and CD have a multitude of common features despite having different etiologies. The change in global epidemiology for these disorders, manifested by increasing IBD burden in the background of stable ITB incidence in India and other developing countries has created a difficulty for gastroenterologists to differentiate between these two [5-7]. The diagnosis of both ITB and CD may be established based on a combination of clinical features, radiological findings, endoscopic and pathological evaluation and laboratory tests. Various similar features have been identified and models have been developed to help correctly diagnose the disorders, however, none of them has been able to conclusively differentiate between the two [8-10]. Despite recommendations to initiate an anti-tubercular therapy (ATT) trial in cases that present as a diagnostic dilemma, it is imperative to correctly differentiate due to the risks of mistreatment [11]. Immunosuppressants used in CD if given to ITB patients can exacerbate and worsen disease progression while ATT given in CD delays diagnoses, puts the patients at risk of ATT induced side effects, and predisposes to stricture formation [12].
Interferon-gamma release assay (IGRA), which measures interferon gamma (IFN-γ) levels when T cells are stimulated by TB complex antigens, has shown promise for the diagnosis of latent TB. The two commonly used tests are QuantiFERON-TB Gold In-Tube (QFT) assay and the T-SPOT.TB assay [13]. Though IGRA has shown good accuracy in diagnosing latent TB, it cannot differentiate between active and latent TB, and the recently published Index-TB guidelines have recommended against its use in the diagnosis of EPTB [14]. However, IGRA testing has demonstrated moderate results in the differential diagnosis of ITB and CD. A meta-analysis of 8 studies that evaluated the role of IGRA in this setting, demonstrated pooled sensitivity and specificity of 81% and 85%, respectively for the diagnosis of ITB [15]. However, there is a lack of such data from India, the region which has one of the highest disease burdens of both ITB and CD.
Hence, we conducted a retrospective study to test the accuracy of IGRA in differentiating between CD and ITB in a TB endemic region. These results may help us in determining if IGRA could be used to diagnose patients who present with diagnostic uncertainty.
METHODS
1. Patient Population
Patients with suspected diagnosis of ITB or CD, under follow-up at the IBD clinic from July 2014 to September 2021, All India Institute of Medical Sciences (AIIMS), New Delhi, India were screened for inclusion. Patients who were eventually diagnosed with ITB or CD and had available IGRA results were finally included. Those with any other established diagnoses except for CD or ITB, incomplete data or lack of IGRA report were excluded. The AIIMS Institutional Ethics Committee approved the experimental protocols (approval No. IEC/50/1/2019). This study is a retrospective study and so informed consent was waived.
2. Study Design
In this retrospective analysis, the details on patient demographics, clinical, radiologic, and endoscopic features, and IGRA and tuberculin skin test (TST) results were extracted from a prospectively maintained database of patient records.
3. Diagnostic Criteria
1) Crohn’s Disease
The diagnosis of CD was established based on clinical features, laboratory tests, radiologic, endoscopic and/or histological findings, as per the European Crohn’s and Colitis Organisation guidelines [16].
2) Intestinal Tuberculosis
The diagnosis of ITB was established based on clinical features, laboratory tests, radiologic, endoscopic and/or histological findings (presence of caseating granulomas/positive acidfast bacilli, positive for Mycobacterium tuberculosis on culture, or positive gene-Xpert) or presence of active TB at other sites.
3) Indeterminate Cases
In patients with diagnostic uncertainty, ATT trial was given and improvement in global symptoms along with mucosal healing after 6 months confirmed a diagnosis of ITB [17]. A diagnosis of CD was made if there was no response to ATT/worsening with ATT and no alternate diagnosis could be made and there was sufficient clinical response on CD directed therapy. Patients presenting with diagnostic uncertainty were given an ATT trial for 2-3 months and were then evaluated clinically. If they did not show any change or had worsening in symptoms, colonoscopy and biopsy were performed and a diagnosis of CD was considered. Other diseases like multi-drug resistant TB and infective causes were excluded before CD diagnosis [17,18].
4) Interferon-Gamma Release Assay
The QFT kit was used for testing. Whole blood (1 mL each) was collected in 2 tubes: nil tube and antigen tube. These tubes were coated on the inner surface for TB specific antigens (ESAT-6/CFP-10/TB-7.7(p4)). The nil tube was the control that adjusted for background, heterophile antibody effects, or non-specific IFN-γ while the antigen tube detected the CD4+ T cell responses to the antigens. The IFN-γ levels of nil tube were subtracted from antigen tube to get the result. An antigen tube-nil tube difference ≥ 0.35 IU/mL or ≥ 25% of nil tube was considered as a positive result. A difference of < 0.35 IU/mL or < 25% of nil tube was taken as a negative result. If the levels in nil tube were > 8.0 IU/mL, the result was considered indeterminate.
5) Tuberculin Skin Test
The TST was performed by injecting 5 tuberculin units (0.1 mL) of PPD-RT23 intradermally. This was read 48-72 hours later for interpretation. A result was considered positive if the size of the induration was greater than 10 mm [19].
4. Statistical Analysis
The data was entered in an excel sheet which was analyzed using IBM SPSS statistics 22 (IBM Corp., Armonk, NY, USA) and MedCalc (MedCalc Software Ltd., Ostend, Belgium). Continuous data were represented as mean ± standard deviation, or median (range) as appropriate and categorical data was represented as a number (percentage). Comparative analyses were performed using the student t-test or chi-square test. A P-value of < 0.05 was considered statistically significant. Using the IFN-gamma levels (IU/mL), a receiver operator characteristic (ROC) curve was generated in SPSS 22 and the area under the curve (AUC) and Youden index were calculated to determine the appropriate cutoff. For concordance between IGRA and TST, the Cohen’s kappa statistic was used.
RESULTS
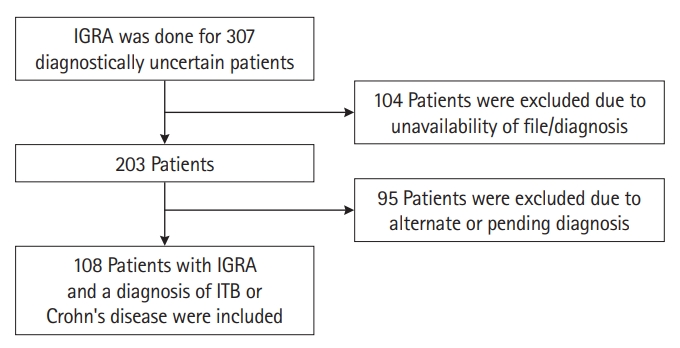
Three hundred and seven patients with suspected CD/ITB underwent IGRA testing at AIIMS, New Delhi. After applying exclusion criteria as mentioned in Fig. 1, 108 patients were included. Out of these, 49 had a confirmed diagnosis of CD (33 definite; 16 after an ATT trial) and 59 had a confirmed diagnosis of ITB (31 definite; 28 after an ATT trial).
1. Baseline Demographic, Clinical, Endoscopic, and Radiological Characteristics
One hundred eight patients were included in the analysis and their demographic characteristics and exposure history are presented in Table 1. Out of the 108 patients, 65 were male and 43 were female. The entire group had an average age of 34.9 ± 13.7 years. The disease duration in patients with CD was significantly higher than patients with ITB (5.1 ± 4.8 years vs. 2.1 ± 3.4 years, P<0.001). There was no difference in other factors including past history of TB (38.8 % vs. 28.8%, P=0.2) between the 2 groups.
Among the clinical features (Table 1), blood in stool was seen in more patients with CD than ITB (36.7% vs. 13.6%, P=0.005). In contrast, abdominal pain and intestinal obstruction were more frequent in the ITB subgroup (P<0.05). Other clinical features were similar between CD and ITB at presentation. The mean hemoglobin was significantly higher in patients with ITB than CD (11.3 ± 2.5 vs. 10.1 ± 2.5, P=0.01). In addition, CD patients had a higher proportion of perianal involvement versus ITB patients (P=0.02).
On endoscopy, the left colon (rectum, sigmoid colon and descending colon) was more commonly involved in CD patients (P<0.05) (Table 1). Specifically, rectum and anal canal were more frequently involved in CD on both computed tomography (CT) and endoscopy and showed statistically significant difference (P<0.05). Also, aphthous, serpiginous and longitudinal ulcers were more frequently seen in CD patients (Table 1). In both subgroups, terminal ileum was the most commonly involved site (CD, 38.8%; ITB, 34.0%).
On CT enterography, both groups had a high frequency of circumferential wall thickening (CD, 51.0%; ITB, 54.2%) (Table 1).
On subgroup analysis, clinical, radiologic, and endoscopic features were compared between IGRA positive and negative patients with CD and ITB respectively (Table 2). Except for TST positivity, intestinal obstruction and terminal ileal involvement (on both endoscopy and CT), which were significantly higher in the IGRA positive CD cohort (as compared to IGRA negative CD cohort) no other statistically significant differences were observed between the groups. Past history of TB was higher in the IGRA positive CD cohort as compared to IGRA negative CD cohort, though the difference was not statistically significant because of small sample size.
2. Accuracy of IGRA for Diagnosis of ITB in the Entire Cohort
IGRA was performed on 108 patients at the presentation. Of these 36 had a positive result and 72 had negative results (P=0.08) (Table 3). True positives were ITB diagnosed patients with positive IGRA (n = 24) while false positive were CD patients who tested positive for IGRA (n = 12). The sensitivity and specificity of IGRA for diagnosis of ITB was 40.68% (95% confidence interval [CI], 28.07%-54.25%) and 75.51% (95% CI, 61.13%-83.66%) respectively. Positive predictive value (PPV) was 66.67% (95% CI, 52.82%-78.13%) and negative predictive value (NPV) was 51.39% (95% CI, 44.79%-57.94%).
3. Accuracy of IGRA for Diagnosis of ITB in Patients without a Past History of Pulmonary TB
Out of the 59 ITB patients, 17 had a past history of pulmonary TB. Upon exclusion of these patients IGRA demonstrated a sensitivity of 47.62% (95% CI, 32.00%-63.58%) and specificity of 75.51% (95% CI, 61.13%-86.66%) for the diagnosis of ITB in comparison to CD.
4. IGRA Cutoff for the Diagnosis of ITB
The kit used to perform IGRA considered levels > 0.35 IU/mL as positive. We were able to extract IGRA levels for 101 out of 108 patients and generated a ROC curve to evaluate if the cutoff of > 0.35 IU/mL was equally relevant for a diagnosis of ITB. The ROC curve is presented in Fig. 2. According to our analysis, at values > 0.33, the sensitivity for the diagnosis of ITB was 43.6% and the specificity was 78.3%. Further, according to the Youden index, the most appropriate cutoff value from the ROC was > 0.21 with a sensitivity of 63.6% and specificity of 69.6%. Finally, the AUC was 0.66 (95% CI, 0.55-0.75) suggesting that IGRA is a poor test in the context of diagnosing ITB.
5. Accuracy of TST for Diagnosis of ITB
TST results were available for 64 out of 108 patients at baseline. Eight patients who tested positive for TST were diagnosed with CD and 22 patients who tested positive were diagnosed as having ITB (P=0.002). According to the data presented in Table 4, the sensitivity and specificity of TST for diagnosis of ITB was 64.7% (95% CI, 46.5%-80.2%) and 73.3% (95% CI, 54.1%-87.7%), respectively. PPV was 73.3% (95% CI, 59.1%-83.9%) and NPV was 64.71% (95% CI, 52.6%-75.2%).
6. Effect of History of TB Infection in Patients with CD and ITB on IGRA Results
Out of the 108 patients, 10 (0.09%) who had a history of TB infection in the past, tested positive for IGRA (P=0.386) (Table 5). Hence, the presence of TB in the past did not significantly affect IGRA positivity.
7. Concordance between IGRA and TST
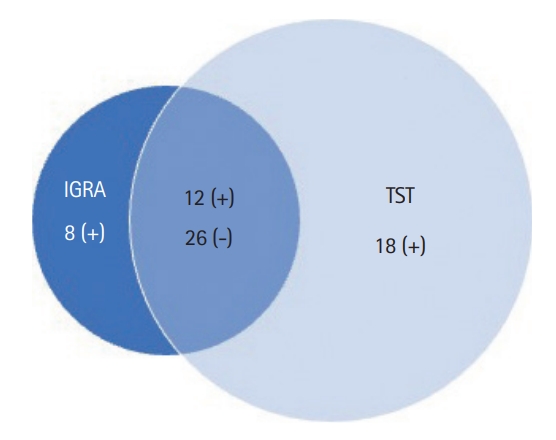
Sixty-four patients underwent both IGRA and TST testing. IGRA and TST alone showed positivity in 31.25% and 46.9% of patients respectively, while both of them were positive in 12 (18.75%), and negative in 26 (40.6%) patients (Table 6). Hence, the results were concordant in 38 (59.4%) patients. The Cohen’s kappa statistic was k = 0.17. The agreement rate between the 2 tests was 59.4%. The results have been shown in Fig. 3.
DISCUSSION
The present study reports on the role of IGRA in the differential diagnosis of ITB and CD in a country with one of the highest TB burdens (incidence of > 200/100,000 population) [1]. This is a significant issue considering India also has one of the highest IBD burdens across the globe [5]. We found a poor diagnostic accuracy of IGRA to diagnose ITB and hence resolve this clinical conundrum. IGRA had a poor sensitivity of 40.7% and a moderate specificity of 75.5% in differentiating between ITB and CD. In a sample size of 108 patients (49 CD and 59 ITB), the PPV for ITB diagnosis was 66.7% and NPV was 51.4%. Even upon excluding ITB patients with a previous history of TB, the sensitivity was 47.62% and specificity was 75.51%, which was similar to the entire cohort. Of the 49 CD patients, 12 were positive for IGRA (false positives), of which, 6 had a history of TB diagnosis in the past, likely due to TB exposure in a highly TB endemic region. While being fairly specific to detect ITB, IGRA had a high false-negative rate, hence, lower sensitivity and NPV, indicating that while a positive IGRA could point towards a diagnosis of ITB, a negative IGRA test should be approached with caution. Our results are similar to the metanalysis by Fan et al. [20] which showed that while QFT had good sensitivity (79%) in high-income countries, it had very poor sensitivity (29%) in middle/low-income countries for diagnosing EPTB. The high false negativity in our analysis may be explained by the low/middle-income status and high TB burden in India. Further, IGRA has previously been shown to have high false negativity for some forms of EPTB like central nervous system TB. Moreover, the above study also found that ITB and possible TB (absence of definite diagnosis) may also be significant risk factors for false-negative IGRA results [21]. Further, in a recent meta-analysis, though advanced age and low lymphocyte counts were predictors of false-negative results, the site of EPTB was also one of the factors accounting for high false negativity associated with IGRA [22]. Studies have also demonstrated levels of IGRA to be associated with the severity of TB [23]. In a retrospective study from China, IGRA levels of > 400 pg/mL correlated with the severity of TB, and levels > 100 pg/mL could differentiate CD and ITB with a sensitivity of 88% and specificity of 74%. There may also be a sensitivity difference due to the type of IGRA test utilized as T.SPOT.TB is more accurate than QFT [20]. Based on the results from our analysis, we do not recommend IGRA-QFT as an ideal test to differentiate between ITB and CD in TB-endemic setups.
Further, TST in comparison, demonstrated a sensitivity of 64.7% (95% CI, 46.5%-80.2%) and specificity of 73.3% (95% CI, 54.1%-87.7%). Hence, TST performed better than IGRA in terms of sensitivity and was almost similarly accurate in terms of specificity.
The results from our study differ from what has been previously shown by other studies. Kim et al. [24] found that in a sample size of 48 patients, IGRA (ELISPOT) versus TST sensitivity was (89% vs. 50%) and specificity was (80% vs. 78%) for diagnosis of abdominal TB. In particular, the accuracy of IGRA in differentiating between ITB and CD was studied in a meta-analysis by Ng et al. [15] From 8 studies that evaluated the accuracy of IGRA, the pooled sensitivity was 81% (95% CI, 75%-86%) and pooled specificity was 85% (95% CI, 81.2%-88.6%) with an AUC of 0.919 in the ROC curve. The accuracy of IGRA in differentiating between CD and ITB was high across the 8 studies with specificity being better than the sensitivity. Out of the 8 included studies, 5 were from Korea and 3 were from China. Additionally, meta-analysis of Xu et al. [25] included 12 studies from Asia and showed a pooled sensitivity of 82.8% (95% CI, 78.4%-86.6%) and specificity of 86.7% (95% CI, 83.2%-89.6%) to differentiate ITB from CD. Our study, which is the first of its kind from India reports contrasting results in comparison to the meta-analysis. While the specificity of IGRA was slightly low, the sensitivity was quite low in our study, which could be explained by differences in TB burden and demographics between India and other countries which have been included in these meta-analyses.
Additionally, we analyzed the cutoff used for the QFT IGRA test. The cutoff of > 0.35 IU/mL had very poor sensitivity and we found that a cutoff > 0.21 may be better (sensitivity, 61.4%; specificity, 68.8%), but still not accurate enough for differentiating ITB from CD. A Chinese study also calculated the optimal cutoff of IGRA in differentiating CD and ITB. However, this study included only patients with IGRA positivity as per the recommended cutoff (14 pg/mL), and then calculated the accuracy of IGRA in this IGRA positive cohort of ITB and CD patients. A cutoff of 100 pg/mL had a better accuracy in differentiating CD and ITB [23].
Our study has a few limitations. The sample size of the study was limited to 108 patients, and it was a retrospective study. The study evaluated only the IGRA-QFT test and not the T-SPOT.TB test due to lack of availability. Bacillus Calmette-Guérin vaccination is a part of the national immunization policy of India and may have affected TST results. To account for the same, we considered a TST positivity cutoff of 10 mm instead of 5 mm.
In conclusion, we found that IGRA may not be an accurate stand-alone test to aid in diagnosis when patients present with diagnostic uncertainty between ITB and CD. It may be used as a part of a diagnostic algorithm and in combination with other clinical features, endoscopic, histological and radiological findings, but its utility to be used alone for differentiating between ITB and CD appears to be limited.