Prevalence of hepatitis B virus and hepatitis C virus infection in patients with inflammatory bowel disease: a systematic review and meta-analysis
Article information
Abstract
Background/Aims
The data on the prevalence of hepatitis B virus (HBV) and hepatitis C virus (HCV) infection in patients with inflammatory bowel disease (IBD) are conflicting. The present systematic review was thus conducted to study the prevalence of HBV and HCV markers in patients with IBD.
Methods
A comprehensive literature search of 3 databases was conducted from 2000 to April 2022 for studies evaluating the prevalence of HBV or HCV in patients with IBD. Pooled prevalence rates across studies were expressed with summative statistics.
Results
A total of 34 studies were included in the final analysis. The pooled prevalence of hepatitis B surface antigen (HBsAg) and hepatitis B core antibodies were 3.3% and 14.2%, respectively. In HBsAg positive IBD patients, hepatitis B e antigen positivity and detectable HBV DNA were seen in 15.3% and 61.0% of patients, respectively. Only 35.6% of the IBD patients had effective HBV vaccination. The pooled prevalence of anti-HCV and detectable HCV RNA were 1.8% and 0.8%, respectively. The pooled prevalence of markers of HBV infection was higher in Asian studies, while the prevalence of markers of HCV infection was higher in European studies. The prevalence of viral hepatitis markers was similar between IBD patients and the general population and that between ulcerative colitis and Crohn’s disease.
Conclusions
The prevalence of markers of viral hepatitis remains same as the general population with significant regional variations, although the quality of evidence remains low due to publication bias. Only a small proportion of IBD patients had an effective HBV vaccination, requiring improvement in screening and vaccination practices.
INTRODUCTION
Inflammatory bowel disease (IBD), which encompasses 2 clinical forms, namely ulcerative colitis (UC) and Crohn’s disease (CD), is a heterogeneous group of inflammatory disorders of the gastrointestinal tract [1]. Though the disease is more prevalent in the West, there has been an increasing incidence in Asian countries in the last two decades [2,3]. The treatment of IBD primarily involves immunosuppressive and immunomodulatory drugs. This not only increases the chance of prevalence of various chronic infective diseases like chronic hepatitis C virus (HCV) and hepatitis B virus (HBV) but also may lead to reactivation of the latter disease [4-6]. This will have more impact on Asian countries due to the moderately high prevalence of HBV infection [7]. Therefore, screening for chronic HBV and HCV is crucial before starting the immunosuppressive treatment in IBD. Nonalcoholic fatty liver disease is becoming more common in patients with IBD [8]. On the other hand, the drugs like thiopurines may provoke liver damage even in the normal liver or may increase the viremia in chronic hepatitis C, leading to the progression of liver fibrosis [9]. Therefore, to prevent the progression of liver disease due to the interplay in the management of IBD and viral hepatitis, identification of viral hepatitis is important in while treating IBD [10].
Although there are scarce case-control data on prevalence of chronic viral infections in IBD patients, the prevalence is thought to be similar to the general population [11]. The European Crohn’s and Colitis Organisation guideline recommends the measurement of IgG antibodies against HBV, and HCV for all IBD patients, either at the initial disease diagnosis or while starting treatment with immunosuppressive agents [12]. There is large data on overall prevalence of HBV and HCV infection among general population. However, to the best of our knowledge, there is hardly any previously published systematic review or meta-analysis on prevalence among IBD patients. The main objective of this meta-analysis was to evaluate the prevalence of HBV and HCV infection in patients with IBD.
METHODS
The present systematic review and meta-analysis were conducted as per the Meta-analysis Of Observational Studies in Epidemiology (MOOSE) [13] and the updated Preferred Reporting Items for Systematic Reviews and Meta-Analyses (PRISMA) [14] guidelines. Institutional review board approval and informed patient consent were not applicable for systematic review and meta-analysis.
1. Information Source and Search Strategy
Electronic databases of MEDLINE, Embase, and Science Direct were searched from 2000 to April 2022 for the title and abstracts of all relevant studies using the keywords: (IBD or “Inflammatory bowel disease” or “Crohn’s disease” or CD or “Ulcerative colitis” or UC) and (Hepatitis B or HBV or Hepatitis C or HCV). Two independent reviewers (S.G. and S.A) screened the title and abstract of the retrieved studies and assessed the full texts for eligibility before including them. The bibliographies of the included studies were searched for any relevant studies. A third reviewer (A.K.) resolved any disagreement.
2. Eligibility Criteria
Studies included in this meta-analysis were prospective or retrospective studies fulfilling the following criteria: (1) Study population–patients with IBD; (2) Diagnostic test–markers of HBV infection (hepatitis B surface antigen [HBsAg], hepatitis B core antibody [anti-HBc], hepatitis B e antigen [HBeAg], and HBV DNA), markers of immunity against HBV (anti-HBs), and markers of HCV infection (anti-HCV and HCV RNA); and (3) Outcomes–seroprevalence of HBV and HCV, effective immunization. Conference abstracts, case series, review articles, correspondences, and editorials were excluded.
3. Data Extraction and Quality Assessment
Data were entered into a structured data extraction form with the following parameters: first author, year of publication, location of study, number of patients, study population description, risk factors for viral hepatitis, history of vaccination, and serological markers. The quality of the included studies was assessed by two reviewers (S.G. and S.K.) using the Joanna Briggs Institute (JBI) critical appraisal tools for use in systematic reviews (Supplementary table 1) [15]. JBI appraisal for incidence/prevalence data includes questions about the appropriateness of study sample and selection, description of setting and subjects, completeness of provided data and analysis, and the appropriateness of measuring the condition. The quality of study was determined as per the score (high: 7–9, medium: 4–6, and low: < 4). A third independent individual (A.K.) was consulted to determine the best score based on any discrepancy in the study quality assessment.
4. Data Synthesis
The pooled proportions were computed using a random-effect method with an inverse variance approach [16]. Prior to statistical analysis, a continuity correction of 0.5 was applied when the incidence of an outcome was zero in a study. Dichotomous variables were analyzed using the odds ratio (OR) and MantelHaenszel test. The heterogeneity was assessed by I2 and the p-value of heterogeneity. A P-value of < 0.10 was taken as statistically significant while I2 values of 25%, 50%, and 75% were considered as cutoffs for low, moderate, and considerable heterogeneity, respectively [17]. The assessment of publication bias was done by evaluating the asymmetry of the funnel plot and quantified using Egger’s test. Sensitivity analysis was performed by analyzing prevalence data based on continent and study design and by leave-one-out meta-analysis. Meta-regression was used to explore heterogeneity induced by the relationship between moderators and study effect sizes. All statistical analyses were performed using RevMan version 5.4 and STATA software version 17 (StataCorp., College Station, TX, USA).
RESULTS
1. Study Characteristics and Quality Assessment
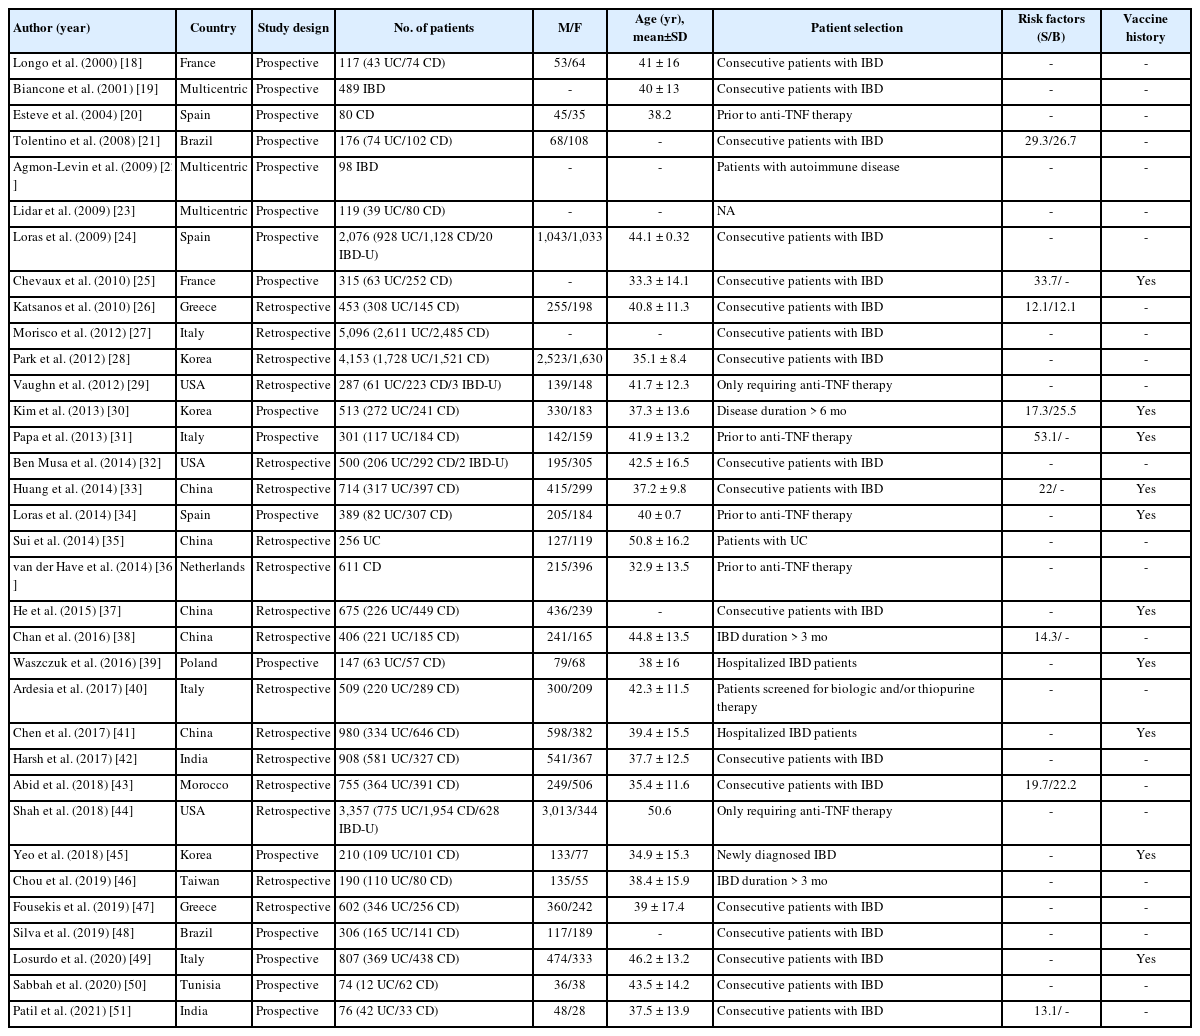
The search strategy yielded 2,194 records from which 1,267 studies were screened after removal of duplicates. Fig. 1 shows the flow chart for study selection and inclusion process. A total of 34 studies [18-51] were included in the final analysis. Table 1 shows the characteristics of the included studies. Among these, 17 studies were prospective [18-25,30,31,34,39,45,48-51] and 17 were retrospective in nature [26-29,32,33,35-38,40-44,46,47]. The majority of the studies were from Europe [18,20,24-27,31,34,36,39,40,47,49] and Asia [28,30,33,35,37,38,41,42,45,46,51]. The number of patients in the studies varied from 74 to 5,096 with a mean age from 32.9 to 50.8 years. Majority of the studies included consecutive patients with IBD while 7 studies [20,29,31,34,36,40,44] analyzed data of patients being planned for biologicals. Prior risk factors for viral hepatitis and vaccination history were reported in 9 studies [21,25,26,30,31,33,38,43,51] and 10 studies [25,30,31,33,34,37,39,41,45,49], respectively. The study quality assessment is summarized in Supplementary Table 1. Among the included studies, 22 studies were of high quality while 12 studies were of medium quality.

Preferred Reporting Items for Systematic Reviews and Meta-Analyses (PRISMA) flowchart showing the study screening and selection process. IBD, inflammatory bowel disease.
2. HBsAg Positivity
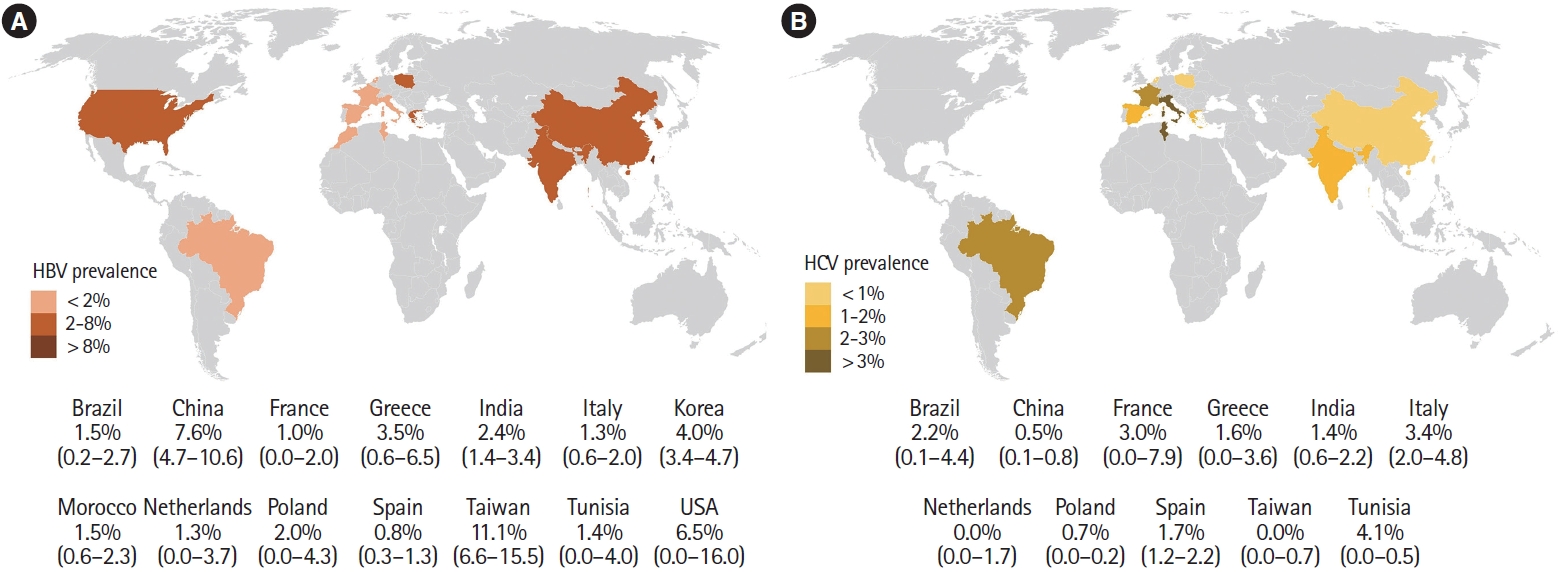
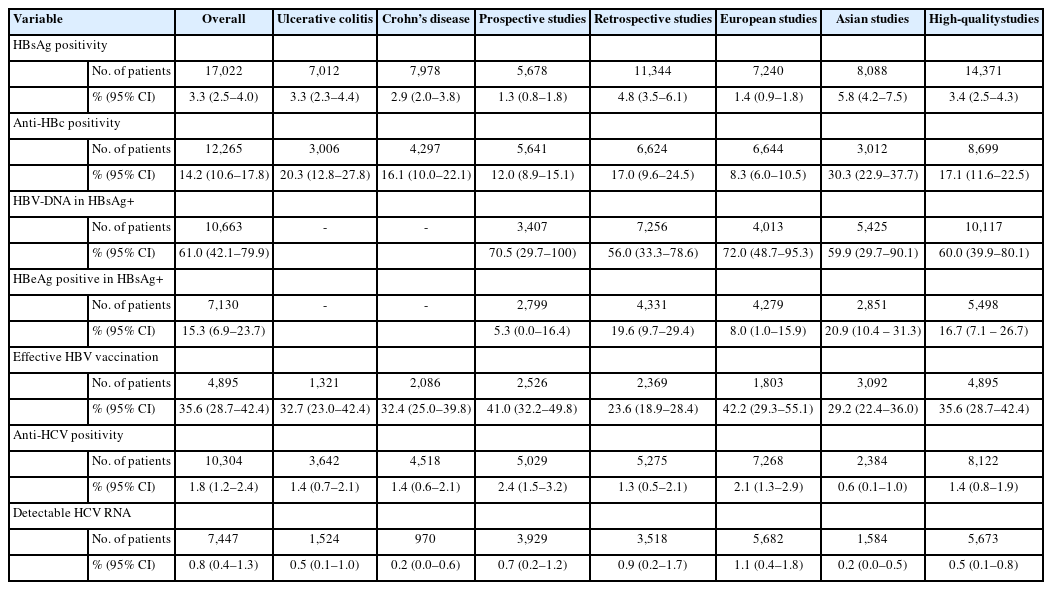
A total of 30 studies [19-21,23-43,44-51] with 17,022 patients reported on HBsAg positivity in patients with IBD. The pooled prevalence of HBsAg was 3.3% (95% confidence interval [CI], 2.5–4.0; I2 = 91.6%) with significant heterogeneity among the studies (Fig. 2). Fig. 3A shows the geographic heat map for HBsAg positivity in IBD patients. On subgroup analysis, the pooled prevalence of HBsAg in patients with UC and CD were 3.3% (95% CI, 2.3–4.4; I2 = 86.5%) and 2.9% (95% CI, 2.0–3.8; I2 = 88.2%) (Supplementary Figs. 1 and 2), respectively. There was neither any difference in the odds of HBsAg positivity between patients with UC and CD (OR, 1.15; 95% CI, 0.96–1.37; I2 = 0%) nor between IBD and general population (OR, 1.08; 95% CI, 0.93–1.24; I2 = 0%) (Supplementary Figs. 3 and 4).
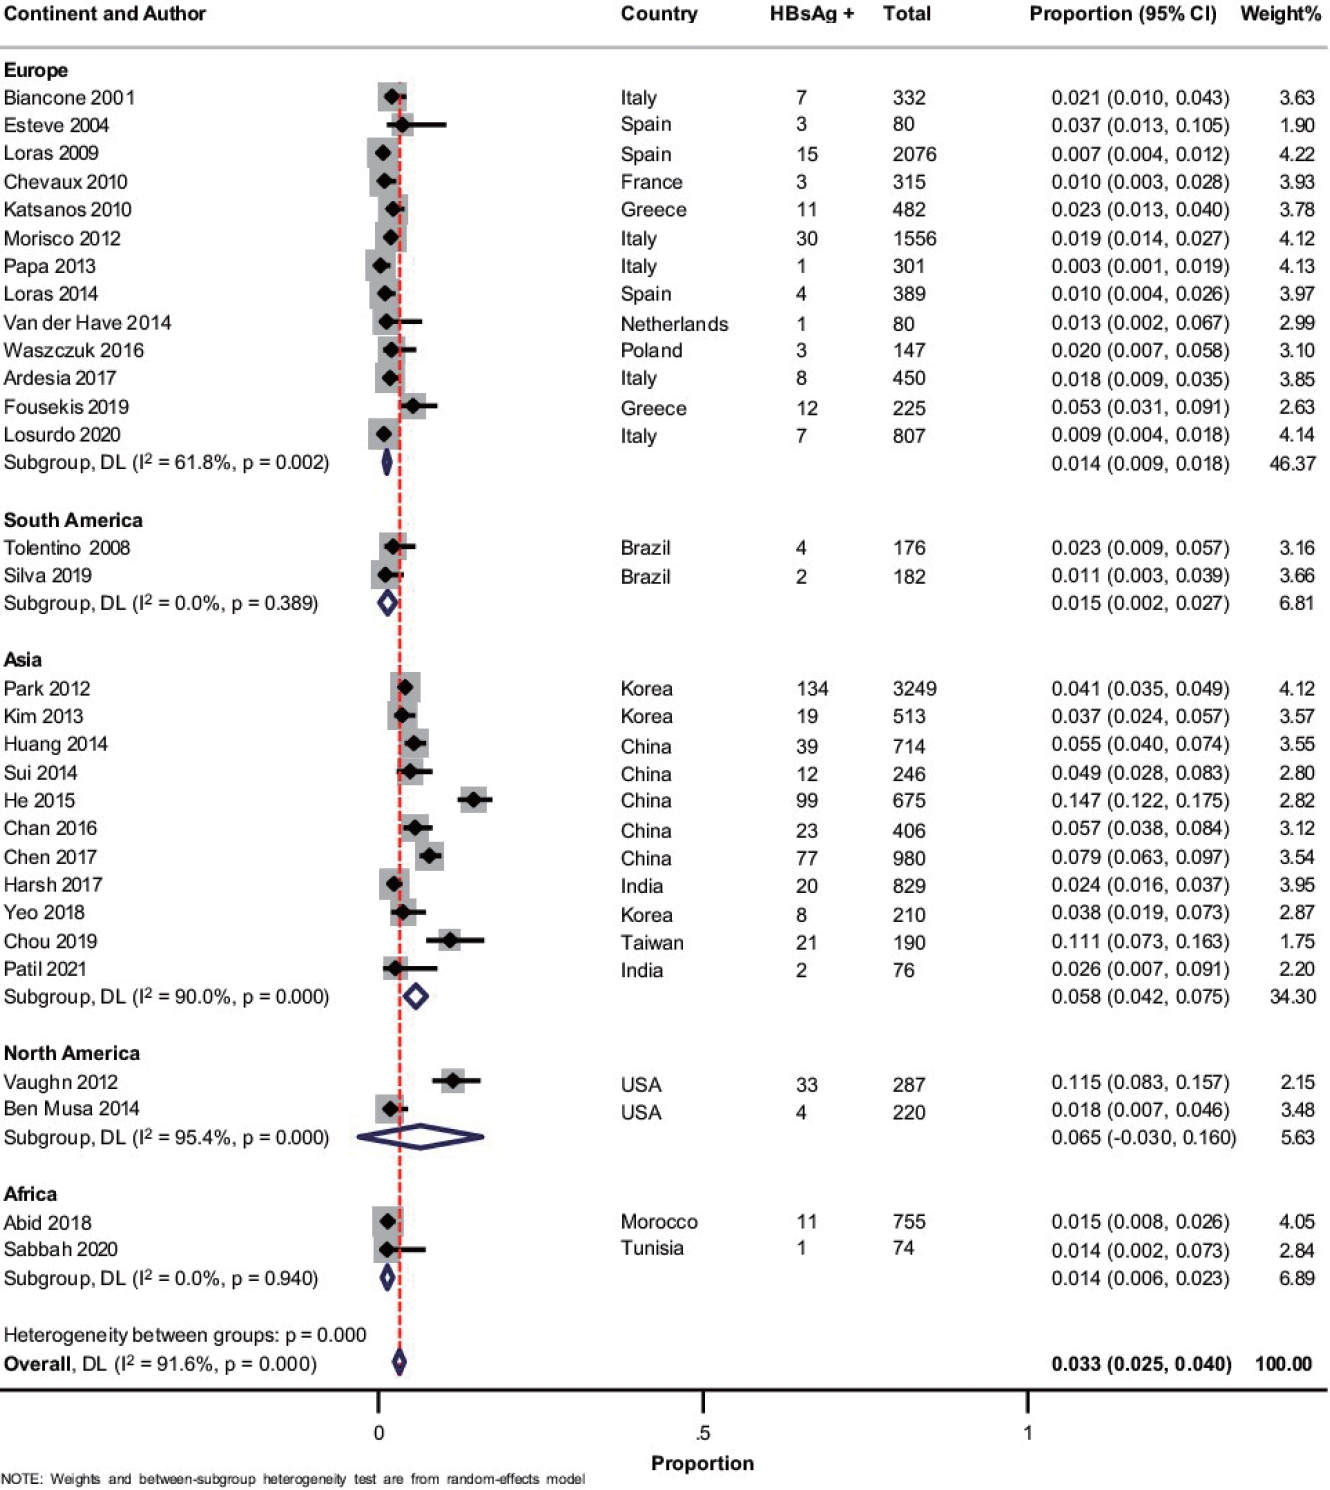
Forest plot showing the pooled prevalence of hepatitis B surface antigen (HBsAg) in patients with inflammatory bowel disease with subgroup analysis based on the continent of study. DL, DerSimonian and Laird method; CI, confidence interval.
3. HBeAg Positivity and Detectable HBV-DNA
Overall, 9 studies [19,23,24,26,31,35,36,39,47] reported on the presence of detectable HBeAg in patients with HBsAg positivity. The pooled prevalence of HBeAg positivity in HBsAg positive cases was 15.3% (95% CI, 6.9–23.7; I2 = 67.9%) (Supplementary Fig. 5). The presence of detectable HBV DNA was reported in 15 studies with 10,663 patients [21,24-26,28,31-34,38,40,41,43,50,51]. The pooled prevalence of detectable HBV DNA in patients with IBD and IBD with HBsAg positive cases were 1.0% (95% CI, 0.6–1.4; I2 = 75.0%) and 61.0% (95% CI, 42.1–79.9; I2 = 91.6%), respectively (Supplementary Fig. 6).
4. Anti-HBc Positivity
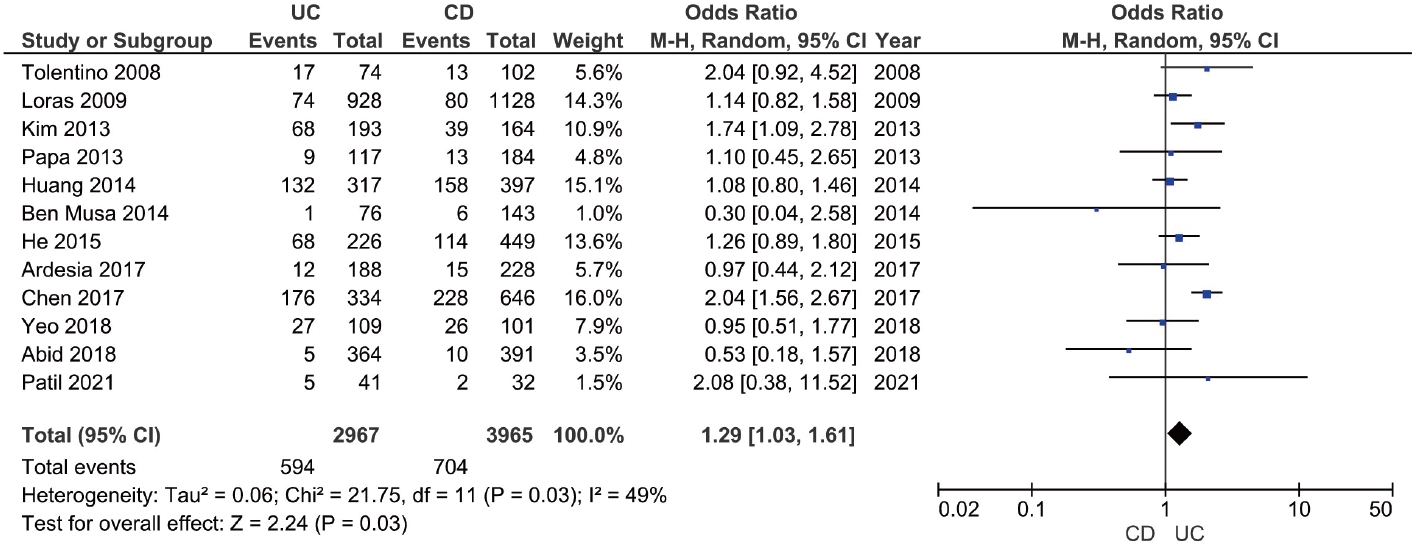
The prevalence of anti-HBc (with or without HBsAg) in patients with IBD was reported in 25 studies with 12,265 patients [19-21,23-25,27,29-34,37,39-41,43-45,47-51]. The pooled anti-HBc positivity in IBD patients was 14.2% (95% CI, 10.6–17.8; I2 = 98.2%), with significant heterogeneity among the studies (Supplementary Fig. 7). On subgroup analysis, the pooled anti-HBc positivity in patients with UC and CD were 20.3% (95% CI, 12.8–27.8; I2 = 98.1%) and 16.1% (95% CI, 10.0–22.1; I2 = 97.8%), respectively (Supplementary Fig. 8 and 9). Patients with IBD had a higher prevalence of anti-HBc positivity compared to controls (OR, 1.48; 95% CI, 1.02–2.13; I2 = 90%) and among patients with IBD (Supplementary Fig. 10), UC was associated with higher odds of anti-HBc positivity compared to CD (OR, 1.29; 95% CI, 1.03– 1.61; I2 = 49%) (Fig. 4).
5. Effective HBV Vaccination
Effective immunization was defined as the presence of antiHBs titer ≥ 10 mIU/mL without anti-HBc and HBsAg. The presence of protective antibody against HBV in patients with completed immunization was reported in 10 studies with 4,895 patients [20,23-25,27,30,31,32,36,38,39,41,46,47]. Among patients with IBD, only 35.6% (95% CI, 28.7–42.4; I2 = 96.5%) of the patients had effective vaccination (Supplementary Fig. 11).
6. Anti-HCV Positivity
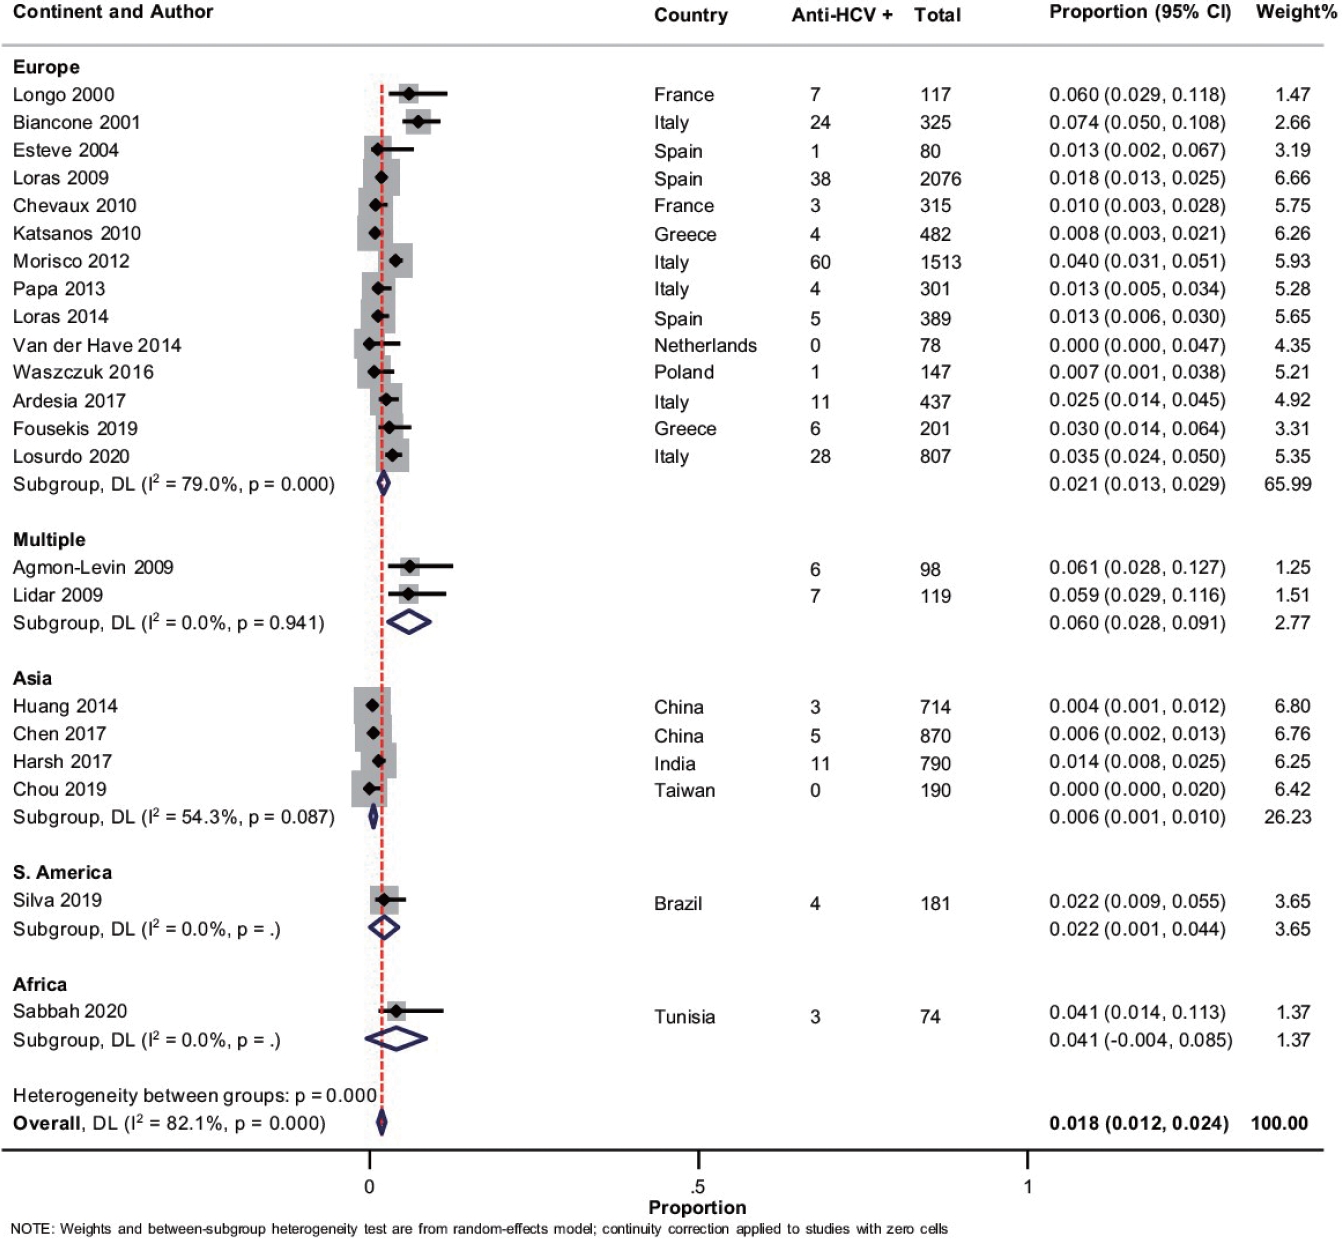
Overall, 22 studies with 10,304 patients of IBD reported on anti-HCV prevalence [18-20,22-27,31-34,36,39-42,46-50]. The pooled prevalence of anti-HCV positivity was 1.8% (95% CI, 1.2–2.4; I2 = 82.1%) with significant heterogeneity among the studies (Fig. 5). Fig. 3B shows the geographic heat map for anti-HCV positivity in IBD patients. On subgroup analysis, the pooled prevalence of anti-HCV in patients with UC and CD were 1.4% (95% CI, 0.7–2.1; I2 = 73.3%) and 1.4% (95% CI, 0.6–2.1; I2 = 80.5%), respectively (Supplementary Fig. 12 and 13). The difference in prevalence of HCV between patients with IBD and general population was reported by 5 studies. Presence of IBD was not associated with an increased odd of HCV (OR, 1.42; 95% CI, 0.93–2.18, I2 = 0%) without any heterogeneity (Supplementary Fig. 14). Overall, 9 studies compared the HCV prevalence between patients with UC and CD. There was no difference in the odds of HCV prevalence between UC and CD (OR, 1.04; 95% CI, 0.54–1.99; I2 = 52%) with significant heterogeneity (Supplementary Fig. 15).
7. HCV RNA Positivity
Overall, 12 studies with 7,447 patients reported HCV RNA positivity in patients with IBD [19,20,24,25-27,31-34,41,47,48]. The pooled prevalence of HCV RNA positivity among patients with IBD and IBD patients with positive anti-HCV were 0.8% (95% CI, 0.4–1.3; I2 = 87.9%) and 78.5% (95% CI, 64.8–92.2; I2 = 91.4%), respectively (Supplementary Fig. 16).
8. Publication Bias, Sensitivity Analysis and Meta-Regression
Significant publication bias for all the outcomes except for the comparison of prevalence of HBV and HCV markers between IBD and general population and patients with UC and CD (Supplementary Fig. 17). On leave-one-out meta-analysis, there was no difference in anti-HBc positivity between UC and CD with the exclusion of the study by Tolentino et al. [21], Kim et al. [30], and He et al. [37]. Similarly, with the exclusion of studies one at time, there was no difference in the anti-HBc positivity between IBD and controls, except for the study by Kim et al. [30] Concerning HCV viremic status, HCV RNA positivity rate reduced to 0.5% (0.2–0.8) with the exclusion of the study by Morisco et al. [27].
Meta-regression analysis was conducted to assess for the source of heterogeneity for various outcomes. For HBsAg positivity and anti-HBc positivity, difference in the continent of study was a significant contributor to heterogeneity (Supplementary Fig. 18). For anti-HCV positivity, the continent of study (P= 0.016), publication year (P= 0.011) and mean age (P= 0.004) of the study population were significant covariates contributing to heterogeneity (Fig. 6).

Meta-regression for the assessment of the source of heterogeneity concerning anti-hepatitis C virus (HCV) in patients with inflammatory bowel disease analyzing (A) year of publication, (B) study continent, (C) sample size, and (D) mean age. CI, confidence interval.
Table 2 summarizes the pooled events rates with sensitivity analysis based on etiology, study design and continent of study.
DISCUSSION
The present analysis provides updated data on the epidemiology of HBV and HCV infection among IBD patients globally. The pooled prevalence of HBsAg in patients with IBD was 3.3% (2.5–4.2), while HBeAg positivity and detectable HBV DNA were seen in 15.3% (6.9–23.7) and 61.0% (42.1–79.9) of the HBsAg positive patients, respectively. The pooled prevalence of anti-HBc in IBD patients was 14.2% (10.6–17.8), while effective HBV vaccination was seen in only 35.6% (28.7–42.4) of the patients. The pooled prevalence of anti-HCV and detectable HCV RNA were 1.8% (1.2–2.4) and 0.8% (0.4–1.3), respectively. The odds of prevalence of HBsAg (OR, 1.08; 95% CI, 0.93–1.24) and anti-HCV (OR, 1.42; 95% CI, 0.93–2.18) were similar between IBD patients and the general population. Similarly, both patients with UC and CD had a comparable prevalence of HBsAg (OR, 1.15; 95% CI, 0.96–1.37) and anti-HCV (OR, 1.04; 95% CI, 0.54–1.99). Although the prevalence of anti-HBc was higher in patients with IBD compared to controls (OR, 1.48; 95% CI, 1.02–2.13) and in patients with UC compared to CD (OR, 1.29; 95% CI, 1.03–1.61), the odds were comparable on sensitivity analysis.
The reported global prevalence of HBsAg in 2016 was 3.9% (3.4–4.6) [52], which is similar to the HBsAg prevalence rate of 3.3% (2.5–4.0) among IBD patients in the present analysis. HBV infection may be particularly significant for patients with IBD. Firstly, IBD is no more the disease of the West, with incidence and prevalence increasing across developing countries where HBV infection is more prevalent [53]. This would imply that many patients with IBD may be exposed and infected with HBV. Secondly, HBV vaccination rates are considerably lower in developing countries, especially amongst the IBD population, which puts them at increased risk of HBV infection [54]. Finally, the immunodeficiency state acquired through immunomodulatory drugs like steroids, thiopurines, biologics, or biosimilars renders patients with IBD more vulnerable to viral reactivation, characterized by viremia with or without clinical manifestations, including fulminant life-threatening hepatitis.
In the study by Loras et al. [55], 36% (9/25) of the HBsAg positive IBD patients on immunosuppression developed reactivation, out of which 6 patients (6/9, 75%) developed hepatic failure. Treatment with ≥ 2 immunosuppressants was an independent predictor of HBV reactivation, while prophylactic antiviral therapy was protective against reactivation. Interestingly, none of the patients with isolated anti-HBc positivity developed HBV reactivation. The study by Park et al. [28] reported liver dysfunction in 25.7% of the HBsAg positive compared to 2.8% of the HBsAg-negative patients receiving immunosuppressive therapy. Lee et al. [56] reported that the liver dysfunction due to viral reactivation was 7.3% after a median time interval of 32.4 months after anti-tumor necrosis factor (anti-TNF) in IBD patients with HBV infection. The proportion of liver dysfunction was significantly higher in the non-prophylaxis group (26% vs. 8%, P= 0.02). The pooled proportion of anti-HBc positivity (present or past HBV infection) was 14.2% (10.6–17.8). This subset of patients has a moderate risk of HBV reactivation with the use of anti-TNF therapy, anti-integrin therapy or moderate to high-dose corticosteroids [6]. Therefore, despite having a similar prevalence as the general population, the risk of reactivation or liver dysfunction remains high, which could be prevented by early detection and treatment. For this reason, both ECCO and BSG guidelines recommend that all IBD patients should be tested for HBsAg, anti-HBs, and anti-HBc, preferably at the time of diagnosis [12,57].
Immunomodulators and immunosuppressants reduce the effective HBV vaccination response [12]. The study by Kim et al. [30] compared HBV markers of IBD patients with age- and sexmatched controls and reported a lower anti-HBs positivity rate (61.8% vs. 73.3%, P< 0.001) and effective vaccination in patients with IBD (38.1% vs. 44.4%, P= 0.04). They reported that around one-third of the IBD patients were susceptible to HBV and age < 30 years was a risk factor for nonimmune status in the multivariate analysis. Subsequent studies by Papa et al. [31] and Huang et al. [33] reported a similar lower rate of effective vaccination in patients with IBD, 23.9% and 21.6%, respectively. The present analysis showed that only around one-third of the IBD patients had effective vaccination and this rate was still lower for Asian studies compared to European studies (29.2% [95% CI, 22.4–36.0] vs. 42.2% [95% CI 29.3–55.1]). In a recent meta-analysis, the pooled OR of HBV response in IBD patients was lower compared to controls (OR, 0.13; 95% CI, 0.05–0.33), with pooled proportion of effective immune response being 39.7% (95% CI, 30.7–49.5) [58].
In the study by Morisco et al. [27] of the 5,096 patients with IBD, only 30.5% and 29.7% patients were investigated for HBV and HCV markers, respectively. Similarly, Vaughn et al. [29] reported that only 25% of the IBD were screened for hepatitis B in the year prior to an anti-TNF being initiated. In a survey from Australia, only 61.3% and 27% of the gastroenterologists screened their patients for HBV infection prior to anti-TNF therapy and corticosteroids, respectively [59]. In a subsequent study from France, 91% of the gastroenterologists screened IBD patients for HBV while only 46% recommended HBV vaccination for seronegative patients [60]. Thus, there is considerable uncertainty and disagreement with respect to screening and vaccination practice in IBD patients and this needs to be improved.
Concerning the variation in the prevalence of HBV across various regions, a previous analysis showed a higher prevalence of HBsAg positive population in the Western Pacific (5.7%; 95% CI, 5.1–6.6) and South-East Asian region (3.5%; 95% CI, 2.9–4.0) compared to European region (1.6%; 95% CI, 1.1–2.1) [52]. The present meta-analysis also showed that Asian studies had a higher pooled prevalence of HBsAg (5.8% [95% CI, 4.2–7.5] vs. 1.2% [95% CI, 0.8–1.6]) and anti-HBc (29.7% [95% CI, 22.1–37.3] vs. 7.5% [95% CI 5.2–9.7]) in the IBD patients compared to European studies.
The global prevalence of viremic HCV infection (HCV RNA-positive cases) for the year 2020 was reported as 0.7% (95% uncertainty interval, 0.7–0.9), which had decreased from the prevalence rate of 0.9% (0.8–1.0) for the year 2015 [61]. The present analysis also showed a similar prevalence of viremic HCV infection (0.8%; 95% CI, 0.4–1.3). Patients with HCV infection who receive immunosuppressive treatment for IBD raise several interesting concerns. Prednisone may negatively affect HCV infection by increasing the viral load. On the other hand, anti-TNF-α in IBD may not lead to reactivation of hepatitis C. Morisco et al. [27] and Loras et al. [55] reported liver dysfunction in 1 out of 10 (10%) and 8 out of 51 (15.7%) of HCV RNA positive patients, respectively. Thus, IBD patients with HCV viremia should be evaluated and treated actively to prevent hepatic dysfunction.
In a previous meta-analysis, the prevalence of anti-HCV was higher in the Asian studies compared to European studies (2.8% vs. 1.8%), but the viremic rate was higher in the Europeans (72.4% vs. 64.4%) [62]. On the contrary, the present analysis showed a significantly higher anti-HCV positivity (2.1% [95% CI, 1.3–2.9] vs. 0.6% [95% CI, 0.1–1.0]) and viremic rate (1.1% [95% CI, 0.4–1.8] vs. 0.2% [95% CI, 0.0–0.5]) in European studies compared to Asian studies. This may be due to the fact that the prevalence of HCV is higher in central Asia, while the studies included in the present meta-analysis were mostly from east, south, and south-east Asia, where the prevalence remains lower [61,62]. One interesting finding from the current meta-analysis was the reduction in the effect size of anti-HCV prevalence with publication year (Fig. 6). This decreasing prevalence of HCV in IBD patients suggests that preventative measures such as blood transfusion safety programs, single-use materials, and better aseptic perioperative rules have been effective and explains the diminishing risk for HCV.
One major limitation of this study was the significant heterogeneity between the included studies. Second, the number of primary studies outside of Asia and Europe was small, and that comparisons with other regions were not possible. It is also a concern that the number of included primary studies may affect the results, since different countries in Europe have different prevalence rates due to differences in vaccination policies [63]. Third, the data on HBV DNA or HCV RNA were unavailable in most studies. Fourth, the prevalence of chronic hepatitis B and C may be warranted in the subclassified group by age, location, and severity. However, unfortunately, no such data on the prevalence in different age groups were available in the included studies. This study estimated the pooled prevalence of hepatitis B and C among the entire IBD participants irrespective of age. So, it is crucial in future prevalence studies to consider prevalence stratification regarding age and other disease variables. Lastly, most studies did not have data on prior treatment history, risk factors, and vaccination.
Nevertheless, this is the first meta-analysis utilizing data globally to evaluate the prevalence of chronic hepatitis B and C markers in IBD patients. The current evidence suggests that the cumulative prevalence of HBV and HCV in IBD patients is sizeable and parallels the national trends in each country. Physicians should be sensitized to implement guidelines’ recommendations in clinical practice to ensure homogeneous screening, prevention, and management of chronic viral hepatitis infection in IBD patients. Further prospective, multicentric and multinational studies are required to understand the actual burden of viral hepatitis in IBD to inform the best possible public health measures and save the direct and indirect costs associated with it.
Notes
Funding Source
The authors received no financial support for the research, authorship, and/or publication of this article.
Conflict of Interest
No potential conflict of interest relevant to this article was reported.
Data Availability Statement
Not applicable.
Author Contribution
Conceptualization: Giri S. Methodology: Giri S, Agrawal D, Afzalpurkar S, Kasturi S, Gopan A. Formal analysis: Giri S, Kasturi S, Gopan A. Project administration: Giri S, Sundaram S, Kale A. Visualization: Giri S. Writing-original draft: Giri S, Agrawal D, Afzalpurkar S. Writing-review and editing: Giri S, Agrawal D, Afzalpurkar S, Sundaram S, Kale A. Approval of final manuscript: all authors.
Supplementary Material
Supplementary materials are available at the Intestinal Research website (https://www.irjournal.org).
Supplementary Table 1. Study Quality Assessment Using Joanna Briggs Institute Critical Appraisal Tool
ir-2022-00094-Supplementary-Table-1.pdfSupplementary Fig. 1. Forest for prevalence of hepatitis B surface antigen in ulcerative colitis. DL, DerSimonian and Laird method; CI, confidence interval.
ir-2022-00094-Supplementary-Fig-1.pdfSupplementary Fig. 2. Forest for prevalence of hepatitis B surface antigen in Crohn’s disease. DL, DerSimonian and Laird method; CI, confidence interval.
ir-2022-00094-Supplementary-Fig-2.pdfSupplementary Fig. 3. Forest plot comparing the prevalence of hepatitis B surface antigen in inflammatory bowel disease (IBD) versus controls. M-H, Mantel-Haenszel; CI, confidence interval.
ir-2022-00094-Supplementary-Fig-3.pdfSupplementary Fig. 4. Forest plot comparing the prevalence of hepatitis B surface antigen in ulcerative colitis (UC) versus Crohn’s disease (CD). M-H, Mantel-Haenszel; CI, confidence interval.
ir-2022-00094-Supplementary-Fig-4.pdfSupplementary Fig. 5. Forest plot for prevalence of hepatitis B e antigen positivity in hepatitis B surface antigen positive patients. DL, DerSimonian and Laird method; CI, confidence interval.
ir-2022-00094-Supplementary-Fig-5.pdfSupplementary Fig. 6. Forest plot for prevalence of detectable hepatitis B virus DNA in hepatitis B surface antigen positive. DL, DerSimonian and Laird method; CI, confidence interval.
ir-2022-00094-Supplementary-Fig-6.pdfSupplementary Fig. 7. Forest plot showing the pooled prevalence of hepatitis B core antibody in patients with inflammatory bowel disease with subgroup analysis based on the continent of study. DL, DerSimonian and Laird method; CI, confidence interval.
ir-2022-00094-Supplementary-Fig-7.pdfSupplementary Fig. 8. Forest plot for prevalence of hepatitis B core antibody in ulcerative colitis. DL, DerSimonian and Laird method; CI, confidence interval.
ir-2022-00094-Supplementary-Fig-8.pdfSupplementary Fig. 9. Forest plot for prevalence of hepatitis B core antibody in Crohn’s disease. DL, DerSimonian and Laird method; CI, confidence interval.
ir-2022-00094-Supplementary-Fig-9.pdfSupplementary Fig. 10. Forest plot comparing prevalence of hepatitis B core antibody positivity in inflammatory bowel disease (IBD) versus controls. CI, confidence interval.
ir-2022-00094-Supplementary-Fig-10.pdfSupplementary Fig. 11. Forest plot for effective vaccination against hepatitis B virus in inflammatory bowel disease. DL, DerSimonian and Laird method; CI, confidence interval.
ir-2022-00094-Supplementary-Fig-11.pdfSupplementary Fig. 12. Forest plot for prevalence of anti-hepatitis C virus in ulcerative colitis. DL, DerSimonian and Laird method; CI, confidence interval.
ir-2022-00094-Supplementary-Fig-12.pdfSupplementary Fig. 13. Forest plot for prevalence of anti-hepatitis C virus in Crohn’s disease. DL, DerSimonian and Laird method; CI, confidence interval.
ir-2022-00094-Supplementary-Fig-13.pdfSupplementary Fig. 14. Forest plot comparing the prevalence of anti-hepatitis C virus in inflammatory bowel disease (IBD) versus controls. M-H, Mantel-Haenszel; CI, confidence interval.
ir-2022-00094-Supplementary-Fig-14.pdfSupplementary Fig. 15. Forest plot comparing the prevalence of anti-hepatitis C virus in ulcerative colitis (UC) versus Crohn's disease (CD). M-H, Mantel-Haenszel; CI, confidence interval.
ir-2022-00094-Supplementary-Fig-15.pdfSupplementary Fig. 16. Forest plot for prevalence of detectable hepatitis C virus (HCV) RNA in anti-HCV positive cases. HBsAg, hepatitis B surface antigen; anti-HBc, hepatitis B core antibody; CI, confidence interval.
ir-2022-00094-Supplementary-Fig-16.pdfSupplementary Fig. 17. Funnel plot. DL, DerSimonian and Laird method; CI, confidence interval.
ir-2022-00094-Supplementary-Fig-17.pdfSupplementary Fig. 18. Meta-regression for source of heterogeneity for hepatitis B surface antigen (HBsAg) in inflammatory bowel disease. CI, confidence interval.
ir-2022-00094-Supplementary-Fig-18.pdf
