Intest Res Search

CLOSE


Intest Res > Epub ahead of print
Karashima, Sagami, Yamana, Maeda, Hojo, Miyatani, Nakano, Matsuda, Hibi, and Kobayashi: Early change in serum leucine-rich α-2-glycoprotein predicts clinical and endoscopic response in ulcerative colitis

Abstract

Background/Aims

Leucine-rich α-2-glycoprotein (LRG) is a new serum biomarker reflecting the disease activity of ulcerative colitis (UC), but its change during the acute phase has not been enough investigated.

Methods

Patients with UC who initiated the induction therapy with steroid or advanced therapy (biologics or Janus kinase inhibitors) were prospectively enrolled. Associations of LRG, C-reactive protein (CRP) and fecal calprotectin (FC) at baseline, week 1, and week 8 with clinical remission at week 8 and subsequent endoscopic improvement within 1 year (Mayo endoscopic subscore of 0 or 1) were assessed.

Results

A total of 143 patients with UC were included. LRG and CRP at week 1 were significantly lower in the clinical remission group than in the non-remission group (LRG, 20.6 μg/mL vs. 28.4 μg/mL, P<0.001; CRP, 0.9 mg/dL vs. 2.3 mg/dL, P<0.001) while FC demonstrated the difference between groups only at week 8. The area under the curves of week 1 LRG, CRP, and FC for week 8 clinical remission using the receiver operating characteristic curves analysis were 0.68, 0.71, and 0.57, respectively. Furthermore, LRG and CRP predicted subsequent endoscopic improvement as early as week 1, while FC was predictive only at week 8.

Conclusions

LRG can be an early-phase biomarker predicting subsequent clinical and endoscopic response to induction therapy.

INTRODUCTION

Ulcerative colitis (UC) is an inflammatory bowel disease (IBD) with repeated remission and exacerbation [1]. It is important to determine the response to treatment early during the induction therapy because the current treatment may have to be switched if it would not lead to favorable treatment outcomes such as clinical response, remission, and ultimately endoscopic remission. Borren et al. [2] reported that short-term endoscopic improvement (median: 9 days) was associated with a lower risk of colectomy. Another study reported colonoscopy at week 1 is useful in predicting colectomy in UC patients treated with cyclosporine [3]. Thus, endoscopy has been considered useful for early disease assessment, but its invasiveness makes it difficult to repeat in such a short interval. We have reported that intestinal ultrasound [4] and the trough level of infliximab (IFX) [5] seem to be useful as well for this purpose, but they are neither validated across different kits/devices nor easily accessible. Fecal calprotectin (FC), a widely used noninvasive biomarker, is not as sensitive in the acute phase [6]. C-reactive protein (CRP) is an interleukin (IL)-6 dependent serum acute phase protein and is reported to be useful in detecting early treatment response in UC [7], but its sensitivity in correlation with endoscopic activity is low (50%-68%) [8-10].
Leucine-rich α-2-glycoprotein (LRG) is a novel serum biomarker for various inflammatory diseases found in patients with rheumatoid arthritis [11]. LRG is induced by IL-22, tumor necrosis factor (TNF)-α, and IL-1β independently of IL-6 [12] and has attracted much attention in recent years. LRG is elevated in active UC and is considered more sensitive than CRP [13]. In a previous report, LRG at week 12 showed a stronger correlation than CRP with the 1-year endoscopic remission group, suggesting that LRG may be more responsive to change [14]. However, changes in LRG in the shorter term have never been studied.
Therefore, we investigated the usefulness of LRG in determining response to induction therapy compared with CRP and FC.

METHODS

1. Study Design

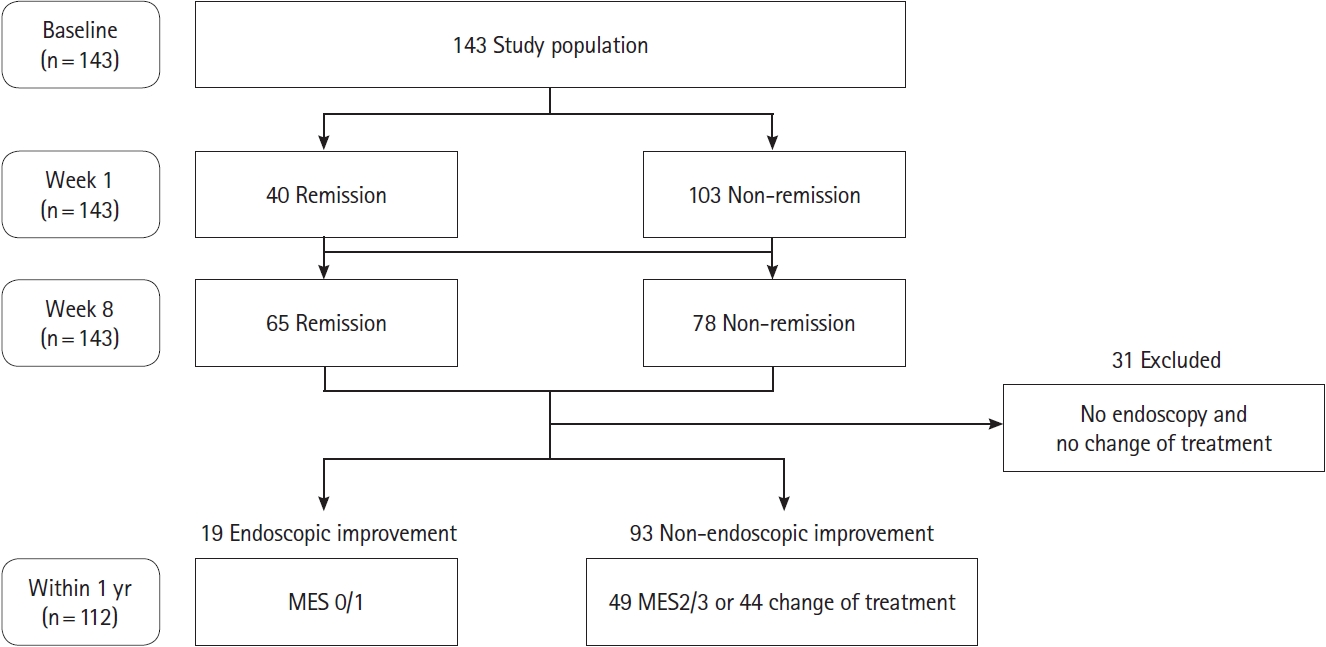
This was a prospective observational study of patients with UC who received induction therapy with systemic steroids or advanced therapies (biologics or Janus kinase inhibitors) at Kitasato University Kitasato Institute Hospital from September 2019 to December 2022. The analysis for endoscopic improvement enrolled patients who underwent colonoscopy within 1 year after induction therapy or who changed their treatment because of lack of efficacy before colonoscopy. Patients who had not undergone endoscopy within 1 year after induction of remission were excluded from the endoscopic outcome. Patients who had undergone colectomy were excluded from both analyses for short-term remission and endoscopic improvement.

2. Biomarkers

LRG, CRP, and FC were measured at baseline, 1 week, and 8 weeks after the start of induction therapy. LRG was measured using latex immunoturbidimetry at Sekisui Medical Co., Ltd., and Kitasato University Kitasato Institute Hospital. FC was stored at 4℃ and measured using NS-Prime automated analyzer (Alfresa Pharma Corp., Osaka, Japan) based on the gold colloid agglutination method.

3. Evaluation

The primary outcome was clinical remission at week 8, defined as patient-reported outcome 2 ≤ 1 and rectal bleeding score of 0 [15]. Patients were classified into 2 groups: patients who achieved clinical remission at week 8 (remission group) and those who did not (non-remission group). The secondary outcome was the endoscopic improvement assessed by colonoscopy performed within 1 year after treatment initiation, defined as Mayo endoscopic subscore (MES) ≤ 1 [16]. The MES was prospectively scored by 12 physicians with at least 5 years of clinical experience of endoscopy during the procedure. Patients who initiated new course, escalated dose of steroids, or switched advanced therapy before outcomes (week 8 or endoscopy) were considered not meeting endpoints. However, no patients received increased doses of steroids during the evaluation. All patients who switched the treatment before the endpoints were due to inadequate response to treatment, not to side effects.

4. Statistics Analysis

Differences between groups were analyzed using the Wilcoxon matched-pairs signed-rank test and the chi-square test. Biomarker correlations were analyzed by the Spearman rank correlation coefficient. Cutoff values were determined using the Youden index. For all tests, a P-value < 0.05 was considered statistically significant. Statistical analysis was performed using the JMP software program (ver. 16.1, SAS Institute Inc., Cary, NC, USA).

5. Ethical Statement

This study was conducted in compliance with the Declaration of Helsinki and clinical trial guidelines. The Research Ethics Committee of Kitasato University Kitasato Institute Hospital approved the research protocol and all related documents (No. 18015 and No. 19003) [17], and the study was registered publicly in the UMIN registry (No. UMIN000032422 and No. UMIN00 0036944). Written informed consent was obtained from all patients included in the study.

RESULTS

1. Patients

A total of 143 patients (85 males and 58 females) were included in this study (Fig. 1). Baseline patient characteristics are shown in Table 1. The 87.4% of patients were pancolitis, with a partial Mayo score of 5.8 ± 1.8 at baseline, colonoscopy was conducted at baseline in 99 patients, with the mean MES of 2.63. The mean and median times of endoscopy from the start of treatment were 183.3 and 174 days, respectively. The most common treatment used as induction therapy was corticosteroid (n = 40).

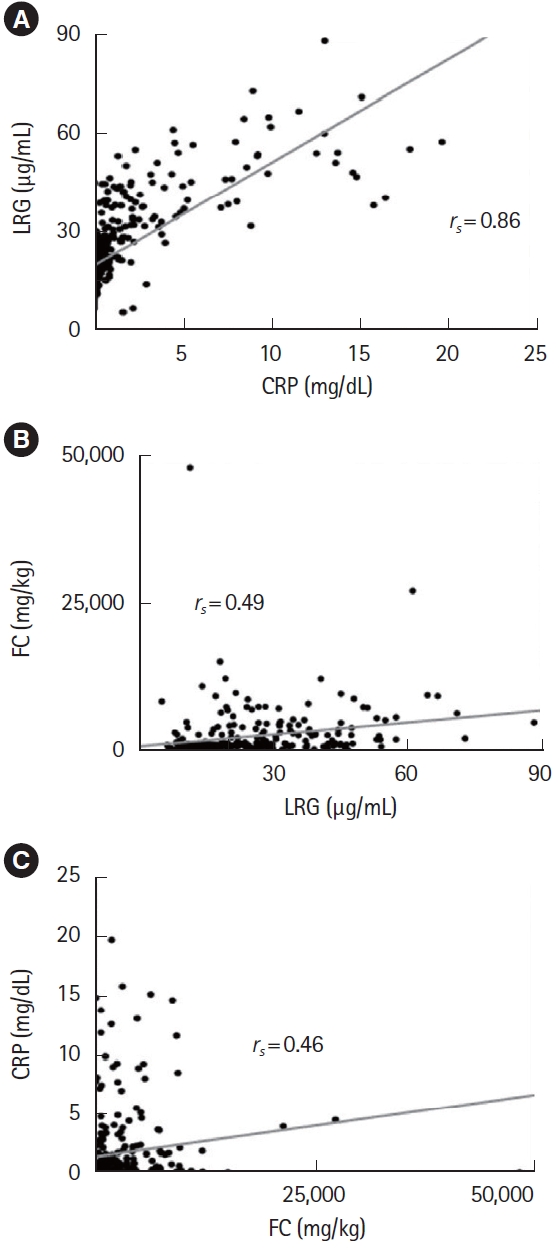
2. Correlation of Biomarkers

First, we assessed the correlation between biomarkers combining all time points (Fig. 2). Correlation between LRG and CRP were excellent (rs = 0.86), whereas FC was less correlated with LRG or CRP (rs = 0.49 and rs = 0.46, respectively).

3. Prediction of Week-8 Clinical Remission

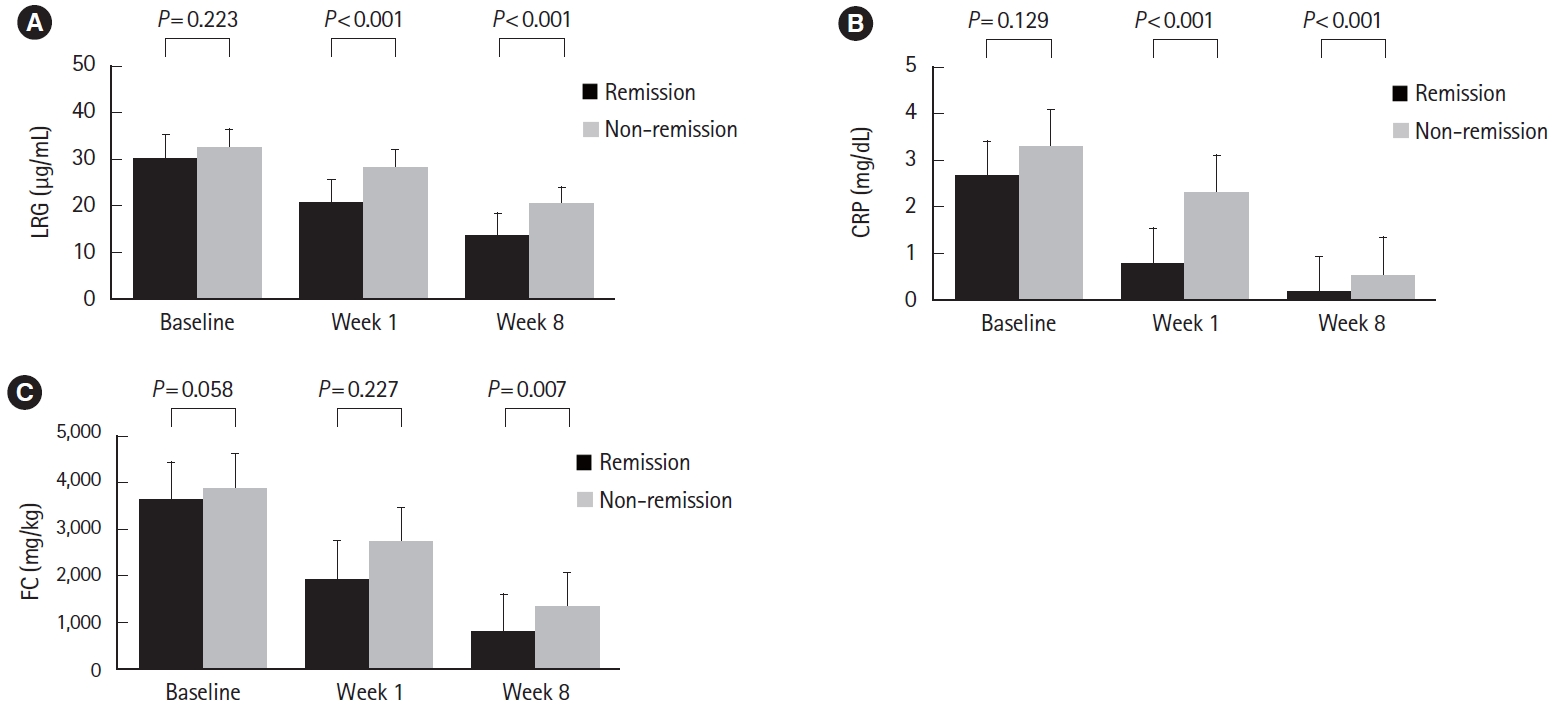
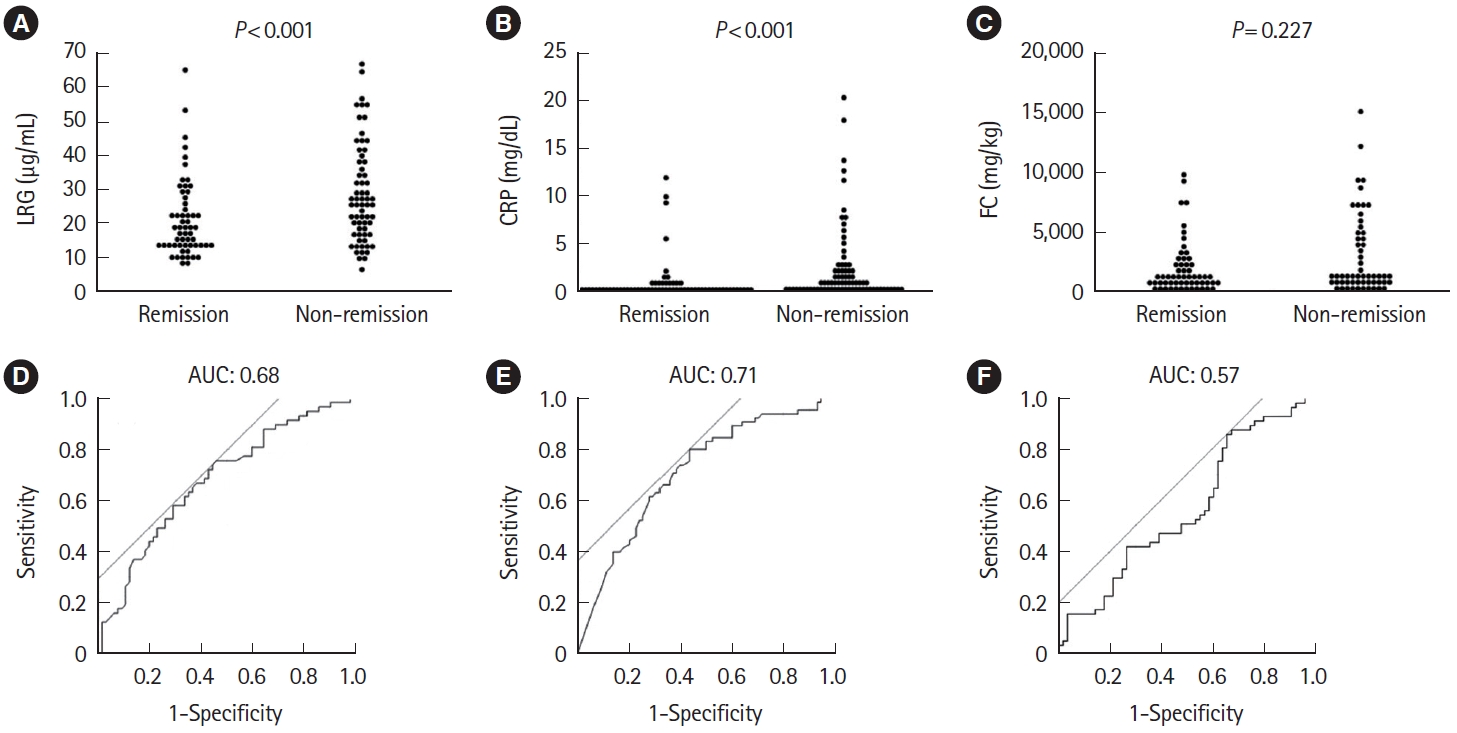
Clinical remission was achieved in 45.5% (65 patients in remission and 78 patients in non-remission) at week 8. All biomarkers decreased over time in both the remission and nonremission groups (Fig. 3). No significant differences were found for all biomarkers at baseline between groups (LRG, 30.1 μg/mL vs. 33.1 μg/mL, P=0.223; CRP, 2.7 mg/dL vs. 3.3 mg/dL, P=0.129; FC, 3,690 mg/kg vs. 3,888 mg/kg, P=0.058). At week 1, LRG and CRP were significantly lower in the remission group (LRG, 20.6 μg/mL vs. 28.4 μg/mL, P<0.001; CRP, 0.9 mg/dL vs. 2.3 mg/dL, P<0.001), while FC showed no significant difference (1,838 mg/kg vs. 2,856 mg/kg, P=0.277). In contrast, LRG, CRP, and FC at week 8 all showed significant differences between groups (LRG, 13.7 μg/mL vs. 20.6 μg/mL, P<0.001; CRP, 0.2 mg/dL vs. 0.6 mg/dL, P<0.001; FC, 545 mg/kg vs. 1,365 mg/kg, P=0.007) (Fig. 4A-C).

4. Accuracy of Predicting Week-8 Clinical Remission

Using receiver operating characteristic (ROC) curves with values at week 1, area under the curve (AUC) was 0.68, 0.71, and 0.57 for LRG, CRP, and FC, respectively, with CRP being slightly numerically highest. Cutoff values were 24.5 μg/mL for LRG, 0.63 mg/dL for CRP, and 3,069 mg/kg for FC, respectively. The sensitivity and specificity for these cutoff values were 0.75 and 0.54 for LRG, 0.80 and 0.56 for CRP, and 0.86 and 0.34 for FC, respectively (Fig. 4D-F).

5. Prediction of Week-8 Clinical Remission in Patients Who Were Not in Remission at Week 1

In clinical practice, objective markers could be more useful in patients whose symptomatic improvement is not evident. Therefore, we next examined the predictive values of biomarkers in 103 patients who had not achieved clinical remission yet at week 1. The remission rate of such patients at week 8 was 35.0% (36 patients in remission and 67 patients in non-remission). Similar to the total patient population, LRG and CRP at week 1 were still significantly different between the remission and non-remission groups (LRG, P=0.006; CRP, P<0.001) (Fig. 5A-C). ROC curves using the week 1 values showed AUCs of 0.68, 0.73, and 0.51 for LRG, CRP, and FC, respectively, with CRP being slightly numerically highest, as was the case for all patients. Cutoff values were 23.9 μg/mL for LRG, 0.59 mg/dL for CRP, and 3,461 mg/kg for FC, respectively (Fig. 5D-F).

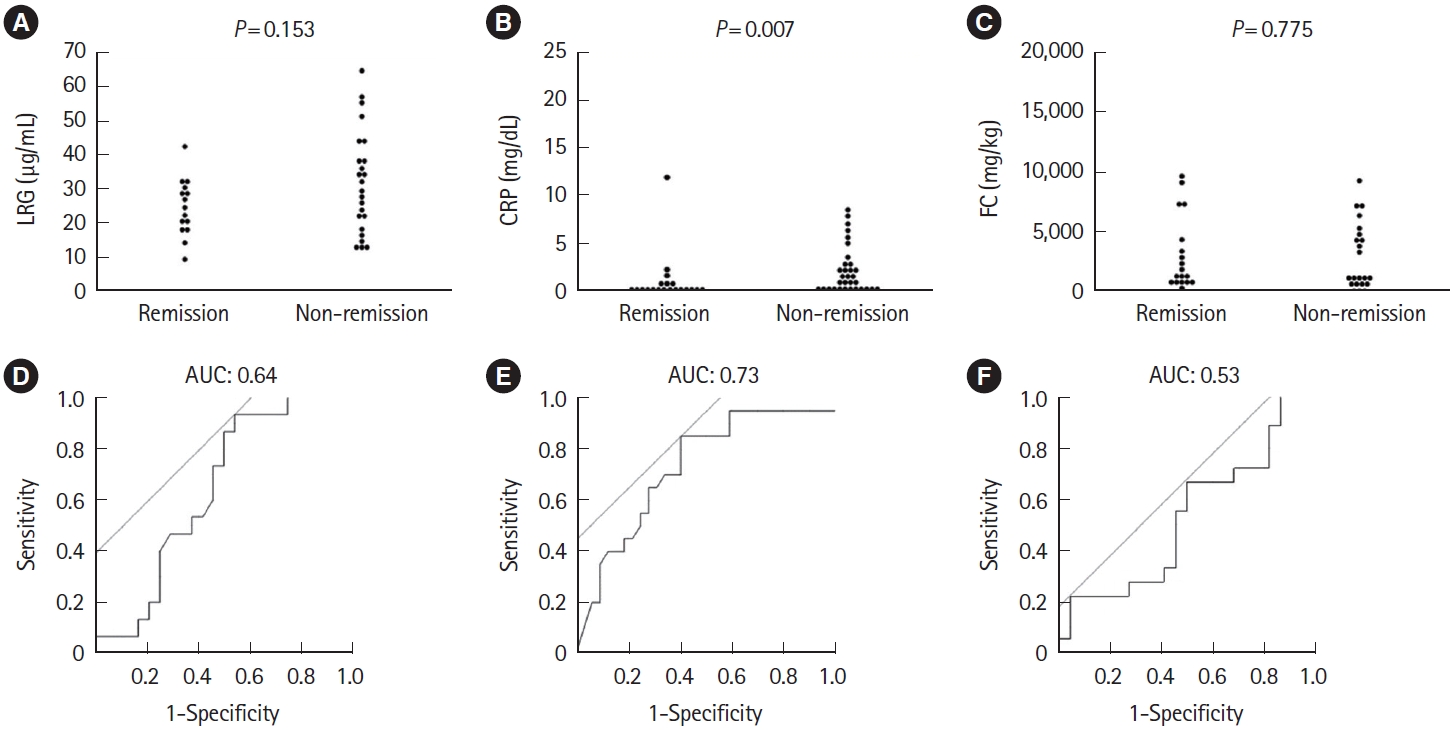
6. Prediction of Clinical Remission at Week 8 in Severe UC

Early prediction of response is more crucial in acute severe UC. Therefore, we conducted the subgroup analysis in severe UC defined as partial Mayo score 7 or above. CRP at week 1 was significantly different between the remission (n = 20) and non-remission (n = 32) groups (P=0.007) (Fig. 6A-C). The ROC curve using the week 1 values showed AUC of 0.64, 0.73, and 0.53 for LRG, CRP, and FC, respectively, with CRP being slightly numerically higher, as in all patients (Fig. 6D-F). The cutoff values were 32.7 µg/mL for LRG, 0.84 mg/dL for CRP, and 7,398 mg/kg for FC, respectively.

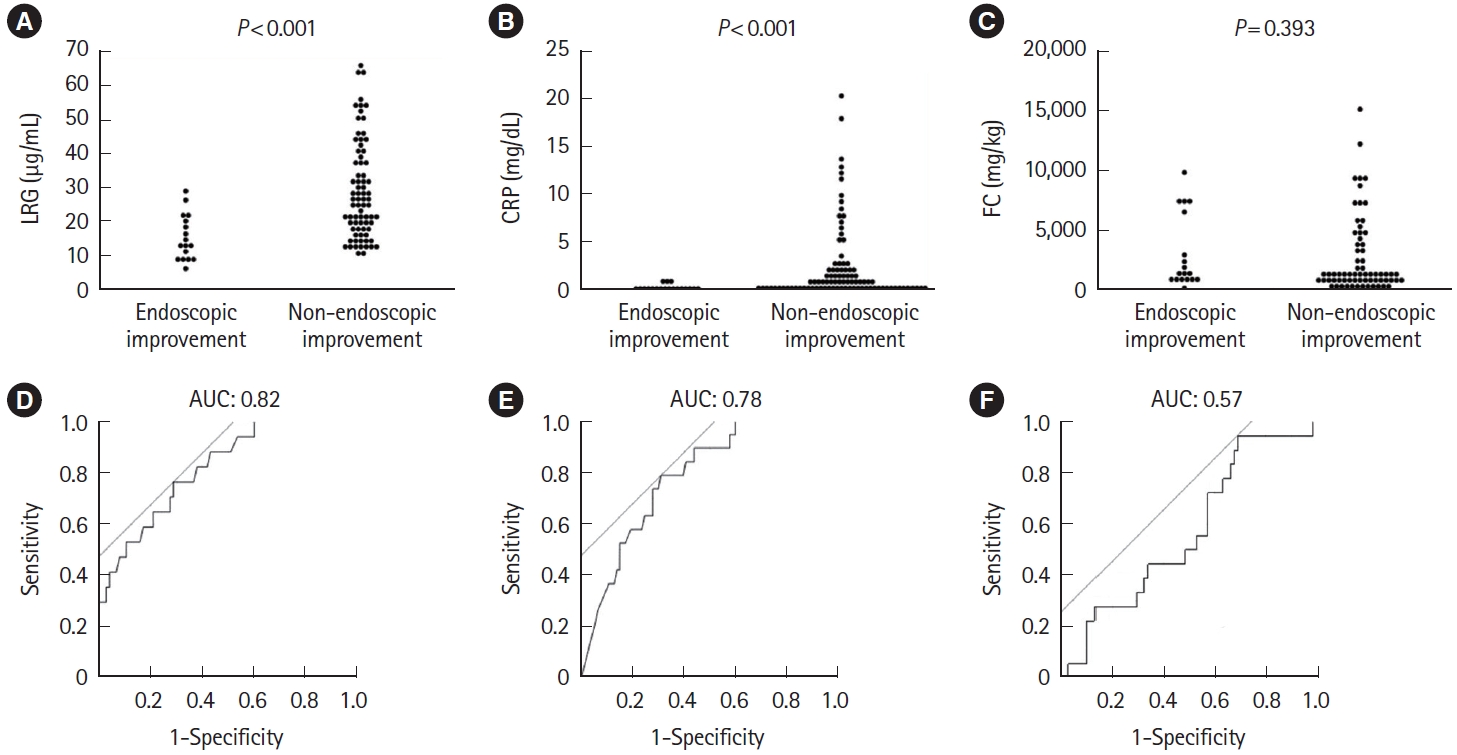
7. Prediction of Subsequent Endoscopic Improvement

Of the 112 patients included, endoscopic improvement was confirmed in 19 patients (17.0%) and 10 patients with MES of 0. LRG and CRP at week 1 were useful predictors of endoscopic improvement within 1 year (LRG, P<0.001; CRP, P<0.001) (Fig. 7A-C). ROC analysis showed that LRG the had numerically highest AUC (0.82) for predicting subsequent endoscopic improvement (Fig. 7D-F) with a cutoff of 19.7 (sensitivity 0.77, specificity 0.71, respectively). Interestingly, AUC at week 8 was numerically highest by FC compared with LRG or CRP (0.72, 0.67, and 0.60, respectively). The rate of endoscopic improvement performed within 1 year was 13.64% (6 patients in endoscopic improvement and 38 patients in non-endoscopic improvement) when limited to severe UC cases. Both LRG and CRP at week 1 were useful predictors of endoscopic improvement within 1 year (LRG, P=0.043; CRP, P=0.035) (Fig. 8A-C). The ROC curve using values at week 1 showed that the AUC remained numerically superior for LRG, with AUC of 0.82 compared with AUC of 0.77 for CRP (Fig. 8D-F).

DISCUSSION

This is the first study to directly compare the short-term change and the predictive value of LRG, CRP, and FC in the early phase after initiating induction therapy for active UC. The results showed that LRG at week 1 was a useful predictor of remission at week 8 as well as CRP, while FC was less accurate. Even when focused on patients who had not achieved clinical remission at week 1, LRG and CRP still showed significant differences between the remission and non-remission groups at week 1. Interestingly, LRG at week 1 was also highly accurate in predicting subsequent endoscopic improvement.
It has been reported that LRG, CRP, and FC all correlate with clinical and endoscopic activity [8,10,12,13,18-20]. In our study, significant differences were found between the remission and non-remission groups for all biomarkers at week 8 after induction therapy, again indicating that they reflect the present activity of UC. It is widely known that CRP and FC are both elevated during the active phase of UC [8,18-22]. Similarly, LRG is also significantly elevated in patients with active UC [12] and has been found to correlate with endoscopic disease activity [13]. Although LRG was reported to be more sensitive than CRP, both LRG and CRP at week 1 were similarly sensitive in predicting clinical remission at week 8, probably because of the nature of acute phase protein, nature of acute phase proteins, which are released in the early stages of inflammation and increase in concentration over a short period of time [23].
In this study, FC at week 1 was not predictive of remission at week 8. In fact, weekly FC measurements in UC patients after IFX induction showed no significant difference in the 1st week and a significant decrease at week 2 in patients with endoscopic remission at week 10 [24]. Another study reported that FC at week 4 after induction therapy was not significantly different between the endoscopic improvement and non-endoscopic improvement groups at week 12 [6]. In contrast, Jain et al. [25] reported that FC measured at baseline and day 3 is a useful predictor of steroid efficacy. Thus, the utility of FC to monitor the short-term response is controversial with diurnal and intra-individual variations [6,26-28]. The difficulty of collecting samples from diarrheal stools during the active phase should also be taken into consideration. In contrast, FC showed the highest predictive value at week 8 for subsequent endoscopic improvement, suggesting the optimal timing of FC measurement after induction therapy.
As previously reported, CRP also detected improvement at week 1 [17]. Although literature suggests that CRP may not be sensitive enough to detect endoscopic activity in the quiescent disease, it was accurate in detecting response to therapy at week 1 in our study enrolling the moderately to severely active UC. Consistent with our results, it has been reported that CRP at weeks 2-4 predicted induction outcomes by IFX [7] or tofacitinib [29], and CRP at day 3 was a predictor of colectomy in 30 days in acute severe UC treated with steroids [30].
Surgery or switching to other drugs is recommended if there is no improvement in 1 week in acute severe UC [31], although such a decision making can be challenging especially when patients show marginal change. Therefore, we assessed the predictive values of biomarkers in patients whose response was not sufficient to achieve remission in 1 week. LRG and CRP were useful biomarkers at week 1 to predict clinical remission at week 8 among such patients, further highlighting their usefulness at week 1.
To the best of our knowledge, this is the first study to predict endoscopic improvement within 1 year using LRG as early as 1 week. It has been reported that LRG measured at weeks 12 and 24 predicted endoscopic remission at week 52 [14]. The same study demonstrated that CRP at week 12 was also predictive [14]. In the present study, LRG at week 1 was useful as a predictor of long-term endoscopic improvement with the highest AUC among the biomarkers. Interestingly, its predictive value was more accurate for long-term endoscopic improvement than that for short-term clinical remission, suggesting an early reduction in LRG is a very accurate predictor of favorable mid-to-long-term outcomes. In addition, it should be noted that the AUC of LRG at week 1 (0.82) had numerically better predictive ability for long-term endoscopic improvement than the AUC of FC at week 8 (0.72). This also suggests that LRG is useful as an early predictive biomarker during the course of induction therapy.
There are several limitations to this study. First, the numbers of serum/fecal samples for biomarkers differed at each time point, especially at week 8. Therefore, the analysis was focused mainly on the use of biomarkers in week 1. Second, it is possible that the optimal timing may differ for each biomarker or each therapeutic agent. Although we analyzed various induction therapies altogether, subgroup analyses were conducted for patients treated with prednisolone (n = 40), anti-TNF (n = 25), and vedolizumab (n = 22). Interestingly, LRG at week 1 was significantly different between the clinical remission and non-remission groups in patients treated with prednisolone (P=0.014) and anti-TNF (P=0.013), while was not different in those who were treated with vedolizumab. Further analysis is needed to clarify the course of biomarker improvement in each therapy. Third, the timing of endoscopic evaluation varied from case to case because of the nature of the observational study. Endoscopic outcomes could have been influenced by the timing of endoscopy. However, the time from the start of treatment in patients with endoscopic improvement and those without did not significantly differ (214.7 vs. 171.1, respectively, P=0.090). Fourth, because the primary purpose of this study was short-term changes of biomarkers in week-8 clinical remitters/non-remitters, we did not determine the timing of endoscopy in the protocol. Therefore, there were 31 patients whose endoscopy was not performed within 1 year. It is possible that those 31 cases had endoscopic improvement, which may have affected the results. Furthermore, since patients who had induced remission with prednisolone were maintained with other treatments, biomarkers at week 1 may not necessarily define their long-term prognosis. Therefore, we conducted a sensitivity analysis excluding those patients, and confirmed the predictability of LRG and CRP at week 1 (AUC of 0.87 and 0.84, respectively).
In conclusion, early response of LRG after initiating induction therapy predicts not only short-term but also mid-to-long-term outcomes. Therefore, short-term measurement of LRG may be a useful strategy in making early clinical decisions.

ADDITIONAL INFORMATION

Funding Source

This work was supported by Kitasato University Kitasato Institute Hospital, Tokyo, Japan (Grant No. 19003).

Conflict of Interest

Sagami S served as a speaker for AbbVie, Takeda Pharmaceutical, Mitsubishi Tanabe Pharma, Gilead Sciences, Janssen Pharmaceutical, Nippon Kayaku and Zeria Pharmaceutical and as an endowed chair for AbbVie, JIMRO, Zeria Pharmaceutical, Kyorin Pharmaceutical, Mochida Pharmaceutical and EA Pharma. Maeda M served as an endowed chair of AbbVie GK, EA Pharma, Zeria Pharmaceutical, JIMRO, Kyorin Pharmaceutical, and Mochida Pharmaceutical. Miyatani Y has served as a speaker of AbbVie; received research funding from Japan Foundation for Applied Enzymology; and as an endowed chair of AbbVie, JIMRO, Zeria Pharmaceutical, Kyorin Pharmaceutical, Mochida Pharmaceutical, Otsuka Holdings, and EA Pharma. Nakano M has served as a speaker or a consultant in Covidien, Mochida Pharmaceutical, Takeda Pharmaceutical, Zeria Pharmaceutical, Kyorin Pharmaceutical, and Nippon Kayaku; received research funding from Mitsubishi Tanabe Pharma and the Japanese foundation for research and promotion of endoscopy. Hibi T has received Lecture fees from Aspen Japan K.K, AbbVie GK, Ferring, Gilead Sciences, Janssen, JIMRO, Mitsubishi Tanabe Pharma, Mochida Pharmaceutical, Pfizer, Takeda Pharmaceutical, Advisory/consultancy fees from Apo Puls Station, AbbVie GK, Bristol-Myers Squibb, Celltrion, EA Pharma, Eli Lilly, Gilead Sciences, Janssen, Kyorin, Mitsubishi Tanabe Pharma., Nichi-Iko Pharmaceutical, Pfizer, Takeda Pharmaceutical, Zeria Pharmaceutical and research grants from AbbVie GK, Activaid, Alfresa Pharma Corporation, JMDC Inc., Gilead Sciences, Inc., Nippon Kayaku Co., Ltd., Eli Lilly Japan K.K., Mochida Pharmaceutical Co., Ltd., Janssen Pharmaceutical K.K., Pfizer Japan Inc., Takeda Pharmaceutical Co., Ltd., Ferring Pharmaceuticals and Bristol-Myers Squibb; received scholarship contributions from Mitsubishi Tanabe Pharma Corporation, Zeria Pharmaceutical Co., Ltd., Nippon Kayaku Co., Ltd.; Pfizer Japan Inc. belonged to study group sponsorship by Otsuka Holdings, AbbVie GK, EA Pharma Co., Ltd., Zeria Pharmaceutical Co., Ltd., JIMRO Co., Ltd., Kyorin Pharmaceutical Co., Ltd., and Mochida Pharmaceutical Co., Ltd. Grants or fund. And he is an editorial board member of the journal but was not involved in the peer reviewer selection, evaluation, or decision process of this article. Kobayashi T received Lecture fees from Takeda Pharmaceutical Co., Ltd., Activaid, Alfresa Pharma Corporation, Zeria Pharmaceutical Co., Ltd., Kyorin Pharmaceutical Co., Ltd., Nippon Kayaku Co., Ltd., Mitsubishi Tanabe Pharma Corporation, Abbie GK, Pfizer Japan Inc., Janssen Pharmaceutical K.K., Thermo Fisher Diagnostics K.K., JIMRO Co., Ltd. research grants from AbbVie GK, Activaid, Alfresa Pharma Corporation, JMDC Inc., Gilead Sciences, Inc., Nippon Kayaku Co., Ltd., Eli Lilly Japan K.K., Mochida Pharmaceutical Co., Ltd., Janssen Pharmaceutical K.K., Pfizer Japan Inc., Takeda Pharmaceutical Co., Ltd., Ferring Pharmaceuticals and Bristol-Myers Squibb; received scholarship contributions from Mitsubishi Tanabe Pharma Corporation, Zeria Pharmaceutical Co., Ltd., Nippon Kayaku Co., Ltd.; and belonged to study group sponsorship by Otsuka Holdings, AbbVie GK, EA Pharma Co., Ltd., Zeria Pharmaceutical Co., Ltd., JIMRO Co., Ltd., Kyorin Pharmaceutical Co., Ltd., and Mochida Pharmaceutical Co., Ltd. Grants or funds Advisory/consultancy fees from Janssen Pharmaceutical K.K., EA Pharma Co., Ltd., KISSEI Pharmaceutical Co., Ltd., Takeda Pharmaceutical Co., Ltd., Activaid, Pfizer Japan Inc., Nippon Kayaku Co., Ltd., Alfresa Pharma Corporation, Kyorin Pharmaceutical Co., Ltd., Abbie GK, Mochida Pharmaceutical Co., Ltd., Mitsubishi Tanabe Pharma Corporation. None of the funding received for this work was from any of the above organizations. The authors not listed have no conflicts of interest to declare.

Data Availability Statement

Data supporting the results are available from the corresponding author (Kobayashi T) upon reasonable request.

Author Contributions

Conceptualization: Sagami S, Kobayashi T. Data curation: Karashima R, Sagami S. Formal analysis: Karashima R, Sagami S. Funding acquisition: Sagami S. Investigation: Karashima R. Methodology: Karashima R, Sagami S, Kobayashi T. Project administration: Kobayashi T. Resources: Sagami S. Supervision: Sagami S, Kobayashi T. Visualization: Karashima R, Sagami S, Maeda M, Hojo A, Kobayashi T. Writing - original draft: Karashima R. Writing - review & editing: all authors. Approval of final manuscript: all authors.

Additional contribution

The authors are grateful for assisting with this study to Kunio Asonuma, Tadae Mori, Toyomi Ishibashi, Kayo Sakata, and Yuki Watanabe. The authors thank Satoshi Kuronuma and Osamu Takeuchi for measuring fecal calprotectin (FC) levels, and the Department of Clinical Laboratory for their expertise in measuring leucine-rich α-2-glycoprotein (LRG). The study is partly supported by Alfresa Pharma Corporation for measuring FC.

Fig. 1.
Patient disposition of the study. MES, Mayo endoscopic subscore.
ir-2023-00135f1.jpg
Fig. 2.
Correlation between biomarkers using Spearman’s rank correlation coefficient. (A) Correlation between LRG and CRP. (B) Correlation between FC and LRG. (C) Correlation between CRP and FC. LRG, leucine-rich α-2-glycoprotein; CRP, C-reactive protein; FC, fecal calprotectin.
ir-2023-00135f2.jpg
Fig. 3.
Changes of biomarkers in response to treatment in ulcerative colitis patients after initiation of induction therapy are shown: values of (A) LRG, (B) CRP, and (C) FC in patients in remission and non-remission groups at week 8 are shown as mean±standard deviation and compared at each time point using the Wilcoxon matched-pairs signedrank test. LRG, leucine-rich α-2-glycoprotein; CRP, C-reactive protein; FC, fecal calprotectin.
ir-2023-00135f3.jpg
Fig. 4.
Comparison of (A) LRG, (B) CRP, and (C) FC at week 1 in the remission and non-remission groups at week 8. Statistical significance was determined by Wilcoxon signed-rank test. Receiver operating characteristic curve analysis of (D) LRG, (E) CRP, and (F) FC at week 1 for clinical remission at week 8. LRG, leucine-rich α-2-glycoprotein; CRP, C-reactive protein; FC, fecal calprotectin; AUC, area under the curve.
ir-2023-00135f4.jpg
Fig. 5.
Comparison of (A) LRG, (B) CRP, and (C) FC at week 1 in the remission and non-remission groups at week 8, limited to patients who were not in remission at week 1 after starting induction therapy. Statistical significance was determined by Wilcoxon signed-rank test. Receiver operating characteristic curve analysis of (D) LRG, (E) CRP, and (F) FC at week 1 for clinical remission at week 8 in patients not in clinical remission at week 1. LRG, leucine-rich α-2-glycoprotein; CRP, C-reactive protein; FC, fecal calprotectin; AUC, area under the curve.
ir-2023-00135f5.jpg
Fig. 6.
Comparison of (A) LRG, (B) CRP, and (C) FC at week 1 in the remission and non-remission groups at week 8, limited to severe ulcerative colitis with partial Mayo score 7 or above at baseline. Statistical significance was determined by Wilcoxon signed-rank test. Receiver operating characteristic curve analysis of (D) LRG, (E) CRP, and (F) FC at week 1 for clinical remission at week 8 in patients not in clinical remission at week 1. LRG, leucine-rich α-2-glycoprotein; CRP, C-reactive protein; FC, fecal calprotectin; AUC, area under the curve.
ir-2023-00135f6.jpg
Fig. 7.
Comparison of (A) LRG, (B) CRP, and (C) FC at week 1 in the endoscopic improvement and non-endoscopic improvement groups for endoscopies performed within 1 year. Statistical significance was determined by Wilcoxon signed-rank test. Receiver operating characteristic curve analysis of (D) LRG, (E) CRP, and (F) FC at week 1 for endoscopic improvement within 1 year. LRG, leucine-rich α-2- glycoprotein; CRP, C-reactive protein; FC, fecal calprotectin; AUC, area under the curve.
ir-2023-00135f7.jpg
Fig. 8.
Comparison of (A) LRG, (B) CRP, and (C) FC at week 1 in the endoscopic improvement and non-endoscopic improvement groups for endoscopies performed within 1 year, limited to severe ulcerative colitis with partial Mayo score 7 or above at baseline. Statistical significance was determined by Wilcoxon signed-rank test. Receiver operating characteristic curve analysis of (D) LRG, (E) CRP, and (F) FC at week 1 for endoscopic improvement within 1 year. LRG, leucine-rich α-2-glycoprotein; CRP, C-reactive protein; FC, fecal calprotectin; AUC, area under the curve.
ir-2023-00135f8.jpg
Table 1.
Baseline Patient Characteristics
Variable Value (n = 143)
Age (yr), mean ± SD 39.8 ± 14.5
Sex, No. (%)
 Male 85 (59.4)
 Female 58 (40.6)
Extent of disease, No. (%)
 Pancolitis 125 (87.4)
 Left-sided 17 (11.9)
 Proctitis 1 (0.7)
Partial Mayo score, mean ± SD 5.8 ± 1.8
Mayo endoscopic subscore, mean ± SD 2.63 ± 0.51
Medication of induction, No. (%)
 Corticosteroid 40 (28.0)
 Anti-TNF-α antibody 25 (17.5)
 Integrin inhibitor 29 (20.3)
 JAK inhibitor 20 (14.0)
 Ustekinumab 17 (11.9)
 Tacrolimus 12 (8.4)

SD, standard deviation; TNF, tumor necrosis factor; JAK, Janus kinase.

REFERENCES

1. Kobayashi T, Siegmund B, Le Berre C, et al. Ulcerative colitis. Nat Rev Dis Primers 2020;6:74.
crossref pmid pdf
2. Borren NZ, Khalili H, Luther J, Colizzo FP, Garber JJ, Ananthakrishnan AN. Second-look endoscopy in hospitalized severe ulcerative colitis: a retrospective cohort study. Inflamm Bowel Dis 2019;25:750-755.
crossref pmid pmc
3. Kobayashi T, Naganuma M, Okamoto S, et al. Rapid endoscopic improvement is important for 1-year avoidance of colectomy but not for the long-term prognosis in cyclosporine A treatment for ulcerative colitis. J Gastroenterol 2010;45:1129-1137.
crossref pmid pdf
4. Sagami S, Kobayashi T, Aihara K, et al. Transperineal ultrasound predicts endoscopic and histological healing in ulcerative colitis. Aliment Pharmacol Ther 2020;51:1373-1383.
crossref pmid pdf
5. Kobayashi T, Suzuki Y, Motoya S, et al. First trough level of infliximab at week 2 predicts future outcomes of induction therapy in ulcerative colitis-results from a multicenter prospective randomized controlled trial and its post hoc analysis. J Gastroenterol 2016;51:241-251.
crossref pmid pmc pdf
6. Toyonaga T, Kobayashi T, Nakano M, et al. Usefulness of fecal calprotectin for the early prediction of short-term outcomes of remission-induction treatments in ulcerative colitis in comparison with two-item patient-reported outcome. PLoS One 2017;12:e0185131.
crossref pmid pmc
7. Iwasa R, Yamada A, Sono K, Furukawa R, Takeuchi K, Suzuki Y. C-reactive protein level at 2 weeks following initiation of infliximab induction therapy predicts outcomes in patients with ulcerative colitis: a 3 year follow-up study. BMC Gastroenterol 2015;15:103.
crossref pmid pmc pdf
8. Schoepfer AM, Beglinger C, Straumann A, et al. Fecal calprotectin more accurately reflects endoscopic activity of ulcerative colitis than the Lichtiger Index, C-reactive protein, platelets, hemoglobin, and blood leukocytes. Inflamm Bowel Dis 2013;19:332-341.
crossref pmid
9. Langhorst J, Elsenbruch S, Koelzer J, Rueffer A, Michalsen A, Dobos GJ. Noninvasive markers in the assessment of intestinal inflammation in inflammatory bowel diseases: performance of fecal lactoferrin, calprotectin, and PMN-elastase, CRP, and clinical indices. Am J Gastroenterol 2008;103:162-169.
crossref pmid
10. Yoon JY, Park SJ, Hong SP, Kim TI, Kim WH, Cheon JH. Correlations of C-reactive protein levels and erythrocyte sedimentation rates with endoscopic activity indices in patients with ulcerative colitis. Dig Dis Sci 2014;59:829-837.
crossref pmid pdf
11. Ha YJ, Kang EJ, Lee SW, et al. Usefulness of serum leucine-rich alpha-2 glycoprotein as a disease activity biomarker in patients with rheumatoid arthritis. J Korean Med Sci 2014;29:1199-1204.
crossref pmid pmc pdf
12. Serada S, Fujimoto M, Terabe F, et al. Serum leucine-rich alpha-2 glycoprotein is a disease activity biomarker in ulcerative colitis. Inflamm Bowel Dis 2012;18:2169-2179.
crossref pmid
13. Shinzaki S, Matsuoka K, Iijima H, et al. Leucine-rich alpha-2 glycoprotein is a serum biomarker of mucosal healing in ulcerative colitis. J Crohns Colitis 2017;11:84-91.
crossref pmid pmc
14. Shinzaki S, Matsuoka K, Tanaka H, et al. Leucine-rich alpha-2 glycoprotein is a potential biomarker to monitor disease activity in inflammatory bowel disease receiving adalimumab: PLANET study. J Gastroenterol 2021;56:560-569.
crossref pmid pmc pdf
15. Colombel JF, Keir ME, Scherl A, et al. Discrepancies between patient-reported outcomes, and endoscopic and histological appearance in UC. Gut 2017;66:2063-2068.
crossref pmid pmc
16. D’Haens G, Sandborn WJ, Feagan BG, et al. A review of activity indices and efficacy end points for clinical trials of medical therapy in adults with ulcerative colitis. Gastroenterology 2007;132:763-786.
crossref pmid
17. Sagami S, Kobayashi T, Aihara K, et al. Early improvement in bowel wall thickness on transperineal ultrasonography predicts treatment success in active ulcerative colitis. Aliment Pharmacol Ther 2022;55:1320-1329.
crossref pmid pdf
18. Henriksen M, Jahnsen J, Lygren I, et al. C-reactive protein: a predictive factor and marker of inflammation in inflammatory bowel disease: results from a prospective population-based study. Gut 2008;57:1518-1523.
crossref pmid
19. Sandborn WJ, Panés J, Zhang H, Yu D, Niezychowski W, Su C. Correlation between concentrations of fecal calprotectin and outcomes of patients with ulcerative colitis in a phase 2 trial. Gastroenterology 2016;150:96-102.
crossref pmid
20. Zittan E, Kelly OB, Gralnek IM, Silverberg MS, Hillary Steinhart A. Fecal calprotectin correlates with active colonic inflammatory bowel disease but not with small intestinal Crohn’s disease activity. JGH Open 2018;2:201-206.
crossref pmid pmc pdf
21. D’Haens G, Ferrante M, Vermeire S, et al. Fecal calprotectin is a surrogate marker for endoscopic lesions in inflammatory bowel disease. Inflamm Bowel Dis 2012;18:2218-2224.
crossref pmid
22. D’Incà R, Dal Pont E, Di Leo V, et al. Calprotectin and lactoferrin in the assessment of intestinal inflammation and organic disease. Int J Colorectal Dis 2007;22:429-437.
crossref pmid pdf
23. Sjöwall C, Wetterö J. Pathogenic implications for autoantibodies against C-reactive protein and other acute phase proteins. Clin Chim Acta 2007;378:13-23.
crossref pmid
24. De Vos M, Dewit O, D’Haens G, et al. Fast and sharp decrease in calprotectin predicts remission by infliximab in anti-TNF naïve patients with ulcerative colitis. J Crohns Colitis 2012;6:557-562.
crossref pmid
25. Jain S, Kedia S, Bopanna S, et al. Faecal calprotectin and UCEIS predict short-term outcomes in acute severe colitis: prospective cohort study. J Crohns Colitis 2017;11:1309-1316.
crossref pmid
26. Lasson A, Stotzer PO, Öhman L, Isaksson S, Sapnara M, Strid H. The intra-individual variability of faecal calprotectin: a prospective study in patients with active ulcerative colitis. J Crohns Colitis 2015;9:26-32.
crossref pmid
27. Wagatsuma K, Yokoyama Y, Nakase H. Role of biomarkers in the diagnosis and treatment of inflammatory bowel disease. Life (Basel) 2021;11:1375.
crossref pmid pmc
28. Du L, Foshaug R, Huang VW, et al. Within-stool and withinday sample variability of fecal calprotectin in patients with inflammatory bowel disease: a prospective observational study. J Clin Gastroenterol 2018;52:235-240.
pmid
29. Dubinsky MC, Magro F, Steinwurz F, et al. Association of C-reactive protein and partial Mayo score with response to tofacitinib induction therapy: results from the ulcerative colitis clinical program. Inflamm Bowel Dis 2023;29:51-61.
crossref pmid pmc pdf
30. Lindgren SC, Flood LM, Kilander AF, Löfberg R, Persson TB, Sjödahl RI. Early predictors of glucocorticosteroid treatment failure in severe and moderately severe attacks of ulcerative colitis. Eur J Gastroenterol Hepatol 1998;10:831-835.
crossref pmid
31. Feuerstein JD, Isaacs KL, Schneider Y, et al. AGA Clinical Practice Guidelines on the management of moderate to severe ulcerative colitis. Gastroenterology 2020;158:1450-1461.
crossref pmid pmc
TOOLS
Share :
Facebook Twitter Linked In Google+ Line it
METRICS Graph View
  • 0 Crossref
  •   Scopus
  • 591 View
  • 69 Download
We recommend


ABOUT
ARTICLE & TOPICS
Article Category

Browse all articles >

TOPICS

Browse all articles >

BROWSE ARTICLES
EDITORIAL POLICY
AUTHOR INFORMATION
Editorial Office
Room 310, Lotte Gold Rose II, 31 Seolleung-ro 86-gil, Gangnam-gu, Seoul 06193, Korea
Tel: +82-2-957-6145    Fax: +82-2-957-6146    E-mail: thekasid@irjournal.org                

Copyright © 2024 by Korean Association for the Study of Intestinal Diseases.

Developed in M2PI

Close layer
prev next