


INTRODUCTION
Cholestatic jaundice is an important clinical condition in infants which results from diminished bile flow and/or excretion, and can be caused by many disorders. Neonatal hepatitis (NH) and biliary atresia (BA) are the two main causes.1 Regardless of the etiology, cholestasis causes injury not only to the patients' liver but also to their intestine.2 The safety of the human body is maintained by effective monitoring of the mucosal surface integrity and protection against potentially harmful compounds such as bacteria, toxins, or antigens. This function of the gut is called intestinal barrier function. The intestinal epithelial barrier function consists of multiple defense mechanisms that can be subdivided into physical and immunological barriers. These barriers can be affected by cholestasis and the absence of bile in the intestinal lumen.3 Bile acids can inhibit the growth of certain bacteria, and the absence of bile salts leads to a disturbed intestinal bacterial balance and overgrowth of gram negative bacteria.4 Bile contains Ig A which maintains the mucosal integrity and binds to bacteria and viruses.5 Bile also contains specific or nonspecific antibodies that can inhibit the adhesion of enteric bacteria to the intestinal mucosa or inhibit bacterial endocytosis by enterocytes and prevent bacterial translocation.6 In addition, bile has trophic effects on the intestinal mucosa, as it increases villous density and induces hypertrophy of the intestinal wall components.4,7
Different tests are used to assess intestinal epithelial cell damage, intestinal tight junction status, and intestinal barrier integrity injury. Many studies reported on the usefulness of fatty acid binding proteins including intestinal fatty acid binding proteins (I-FABP) and ileal bile acid binding protein (I-BABP) as markers of intestinal epithelial cell damage, and plasma D-lactate level as a marker of barrier function impairment.8 The present study aimed to determine whether gut barrier integrity was impaired in infants with cholestasis by evaluation of I-FABP and I-BABP as markers of intestinal epithelial cell damage and plasma D-lactate level as a marker of gut wall permeability.
METHODS
1. Patients and Protocol
This case-control study included 53 infants with cholestasis and 29 age- and sex-matched, healthy controls. Patients were recruited from the Pediatric Hepatology and Gastroenterology Unit of Assiut University Children Hospital, Egypt, from June 2013 to December 2014. This study was approved by the Ethical Committee of the Faculty of Medicine, Assuit University, and performed in accordance with the latest revision of Declaration of Helsinki. Informed consent was obtained from the participants' parent/legal guardians.
All infants with persistent neonatal jaundice admitted to the Hepatology and Gastroenterology Unit of Assiut University Children Hospital, Egypt, during the study period were subjected to full history taking thorough clinical examination including age at onset of jaundice, birth weight, stool color, any signs of systemic diseases, presence of any organomegaly, assessment of growth state, and ophthalmologic examination. Liver function tests including measurement of serum ALT, AST, ALP, GGT, albumin, total bilirubin (TB), and direct bilirubin (DB) levels were performed in all patients using the BM Hitachi 911 Chemistry Analyzer (Boehringer Mannheim GmbH, Mannheim, Germany). The INR was also assessed in all patients.
Cholestatic jaundice in the infants is defined as an elevation of the serum conjugated bilirubin level greater than 1.0 mg/dL if the TB is less than 5 mg/dL, or more than 20% of the TB level if the TB is greater than 5 mg/dL.1 Liver cell failure was diagnosed when hepatic-related coagulopathy complicated by ascites and/or any degree of mental alteration (encephalopathy) was present in a patient with previously diagnosed chronic liver disease.9
The infants included in this study were further divided into three groups: the NH group, BA group, and healthy controls. Patients were excluded if they had other causes of persistent neonatal jaundice, prior intestinal surgery, intestinal resection, total parenteral nutrition exposure, or current use of antibiotics and/or probiotics.
To determine the etiology of cholestasis in infants who fulfilled the inclusion criteria, the following tests were performed according to the diagnostic algorithm of the North American Society for Pediatric Gastroenterology, Hepatology & Nutrition Cholestasis Guideline Committee:1 complete blood count; urinalysis; urine reducing substances; thyroid function tests; bacterial culture of both urine and blood; and serological tests for cytomegalovirus, rubella, toxoplasmosis, syphilis, and serum ╬▒1-antitrypsin, when indicated. All subjects underwent ultrasonography of the abdomen, hepatobiliary scintigraphy, and percutaneous liver biopsy.
2. Measurement of Serologic Markers
All cases and controls had the following parameters measured: serum FABP and BABP were measured using a commercially available ELISA kit that selectively detects human I-FABP and I-BABP. The concentration of I-FABP was measured by the ELISA kit (Glory Science Co., Ltd., Del Rio, TX, USA; catalog number: 96623, at a wavelength of 450 nm). The concentration of I-BABP was measured by the ELISA kit (Glory Science Co., Ltd.; catalogŌēĀ: A1165, at a wavelength of 450 nm). The ELISA was performed following the supplier's protocol. Quantitative determination of D-lactate (Sigma Aldrich, St. Louis, MO, USA) was performed by using simple and rapid HPLC using an ODS column with UV detection. The separation was effected on the ODS column, using a mobile phase composed of phosphate buffer (NaH2PO4, sodium dihydrogen-phosphate 10 mM, pH 3.5; Sigma Aldrich) mixed with acetonitrite that was obtained from Biosolve, at a ratio of 85% to 15% V/V using isocratic elution at a flow-rate of 1 mL/min. The UV detection was carried out at 210 nm, and the retention time was found to be 4 minutes. The injected volume was 20 ┬ĄL.
3. Statistical Analysis
Categorical variables are presented as number and percentage, while continuous variables are presented as mean, SD, and median. The chi-square test was used to compare categorical variables. Continuous variables were tested for normal distribution, using the Kolmogorov-Smirnov test and Q-Q plots. To compare between continuous variables, the t-test (parametric test) and Mann-Whitney U test (nonparametric test) were used. The Kruskal-Wallis H test was used for multiple comparisons. Pearson's correlation coefficient was used to assess the association between continuous variables. A two-tailed P-value <0.05 was considered statistically significant. All analyses were performed with the SPSS version 20.0 (IBM Corp., Armonk, NY, USA).
RESULTS
2. Serum Level of I-FABP, I-BABP, and D-lactate in Cases and Controls
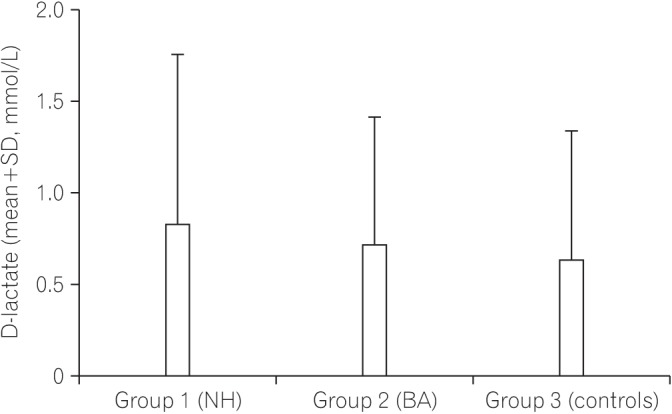
Fig. 1 shows a comparison of the serum level of I-FABP between the NH group, the BA group, and the controls. The serum level of I-FABP in the NH group and BA group was significantly higher than that in the control group. Fig. 2 shows a comparison of the serum level of I-BABP between the NH group, the BA group, and the controls. The serum level of I-BABP in the NH group and BA group was significantly higher than that in the control group. Fig. 3 shows a comparison of serum level of D-lactate between the NH group, the BA group, and the controls. There was no statistically significant difference in the serum level of D-lactate between both groups and the controls.
3. Correlation between the Studied Parameters
There was no significant correlation between the serum levels of I-FABP and D-lactate in cholestatic infants in the NH group (r=0.07 and P=0.726) and the BA group (r=0.01 and P=0.959). Furthermore, there was no significant correlation between I-BABP and D-lactate serum levels in the NH group (r=0.04 and P=0.835) and BA group (r=0.2 and P=0.385).
Table 3 shows that in infants in the NH group and BA group, there were no significant correlations between the serum levels of I-FABP, I-BABP, or D-lactate and the total or DB levels.
DISCUSSION
Although proper intestinal barrier function is pivotal for preserving optimal health and balance throughout the body, there have been few studies of gut barrier function in relevant clinical situations in humans.10,11 Over the past decades, there has been evidence that intestinal barrier integrity loss plays a key role in the development of multiple diseases.8 Earlier studies investigated the possibility of intestinal barrier integrity loss in adults with sepsis, inflammatory, autoimmune diseases, and obstructive jaundice before and after surgery.11,12,13 This study is the first to assess the intestinal barrier integrity in infants with cholestasis at our locality.
Previous studies showed the benefit of FABPs as markers of intestinal epithelial cell damage.14,15,16,17,18 Pelsers et al.19 and Derikx et al.20 studied the distribution of these FABPs and reported that I-FABPs are expressed in the jejunum and to some extent in the colon, whereas I-BABPs are exclusively present in the ileum. This study showed that both I-FABP and I-BABP levels were significantly higher in both groups of cholestatic infants (infants with NH and infants with BA) than controls; however, there were no differences between these two groups in any of the parameters studied. This indicates that nearly all parts of the small intestine (jejunum and ileum) and to a less extent the colon could be affected in infants with cholestasis regardless of the cause of cholestasis. Previous studies have shown that bile acids increase villous density, induce hypertrophy of the intestinal wall components, enhance intestinal epithelial cell proliferation, and protect against apoptotic cell death.4,7,21,22 Such data may explain the intestinal epithelial cell damage in infants with cholestasis.
The integrity of the gastrointestinal epithelia is fundamental for maintaining the function of the barrier (sealing the host interior against potentially harmful bacteria, toxins, or antigens).23 Regarding the functional assessment of the intestinal barrier, several studies have reported that the intestinal barrier function loss leads to transmigration of luminal content such as endotoxins and bacterial fermentation products to the circulation.10,24 Therefore, plasma levels of these bacterial components or products can be used as an indicator for barrier function integrity.3,8
In the present study, the functional assessment of intestinal barrier loss was performed by evaluating the plasma D-lactate level. This test was chosen because it is a simple single blood test, and various studies8,25,26 suggest that the plasma D-lactate levels could serve as an indicator for impaired barrier function. The present study showed that there was no statistically significant difference in the plasma D-lactate level between infants with cholestasis (both the NH and BA groups) and controls. Furthermore, there were no significant correlations between I-FABP, I-BABP, and D-lactate serum levels were found. Therefore, the present study did not provide any evidence of increased permeability of the intestinal wall (translocation of the luminal content to the circulation) as measured by the plasma D-lactate level. These results differ from results of previous studies in animal models25 and in humans26 which reported that the plasma D-lactate level increased early after damage of the intestinal mucosal barrier. The difference may be due to the fact that in previous studies, the increased plasma D-lactate level was observed in a variety of conditions with severe intestinal injury such as intestinal ischemia reperfusion, acute necrotizing pancreatitis, open aortic surgery, burns, IBD, or after trauma.
The intestinal injury in infants with cholestasis included in this study may not be severe enough or may need a longer duration to cause functional impairment in these infants. This point warrants further research. The results of this study showed that there was no evidence of increased translocation of luminal content of bacterial fermentation products to the circulation. What is clear, however, is the difference between infants with cholestasis and controls in the intestinal epithelial integrity regarding disruption of the physical intestinal barrier.
In a small series27,28 of patients, the disruption of the physical intestinal barrier with lining of epithelial cells, which are connected by tight junctions, was suggested to play a role in the development of systemic inflammatory response syndrome, sepsis, and multiple organ failure. Further efforts will be needed to define the impact of compromised gut barrier integrity on the morbidity and clinical management of cholestatic infants. In this study, no significant correlations between D-lactate, I-FABP, or I-BABP and total or DB level were found. A previous study10 reported that an impaired barrier function directly correlates with the plasma bilirubin level. The difference may be due to the difference in the age group of patients or the difference in the test used to assess the intestinal function. These results may indicate that intestinal epithelial integrity is breached once cholestasis occurs, and this does not depend on the plasma bilirubin level.
In conclusion, the intestinal epithelial barrier integrity is breached nearly in all parts of the intestine in infants with cholestasis. Further research is recommended to determine the impact of this finding on the management of these infants. The relationship between physical intestinal barrier damage and its functional failure remains subject for further research.