


INTRODUCTION
Irritable bowel syndrome (IBS) is a common functional gastrointestinal disorder that affects patients' quality of life.1 IBS is characterized by symptoms such as abdominal pain or discomfort, alteration of bowel habits, relief of symptoms upon defecation, aggravation because of psychological strain, symptom-free periods during sleep, and absence of organic abnormalities on colorectal examination.2 Prevalence ranges from 10% to 15% of the general population in major developed countries.3
It is well recognized that stress,4 psychological disorders,5 visceral hypersensitivity, and colonic spasms6 are related to the pathophysiology of IBS. In the Rome III criteria,2 IBS is diagnosed mainly by clinical symptoms since pathognomonic diagnostic measurements for IBS are still lacking. Four IBS subtypes, IBS with constipation (IBS-C), IBS with diarrhea (IBS-D), mixed IBS (IBS-M), and unsubtyped IBS, are classified based on the predominant stool pattern only.2 In the differential diagnosis of IBS, colonoscopy and CT are used primarily to exclude organic diseases, rather than to evaluate colonic motility and morphology. Therefore, limited information is obtained from these examinations on patients with IBS.
Several pathophysiological mechanisms have been suggested to underlie IBS, including effects of microbiota,7 mucosal inflammation,8 immune system alterations,9 and altered intestinal motility.10 Although diagnostic criteria for IBS have been developed, including the Manning and Rome I, II, and III criteria, there is no information on the involvement of mental stress.
Since psychosocial stress can be exacerbated because of endoscopic procedures, we focused on the persistent colonic dysmotility observed in response to the psychological stress of the colonoscopy procedure itself in the present study.11 However, while sedation can reduce discomfort, it can also mask the psychological influence of the colonoscopy procedure on colonic motility. We have previously reported the water-aided colonoscope insertion technique, called the ŌĆ£collapse-submergence methodŌĆØ or ŌĆ£water-navigation method.ŌĆØ12,13,14,15 Using this technique, colonoscopy can be performed without the administration of sedatives. When colonoscopy was performed without sedatives during cancer screening in men, colonic movements such as peristalsis and spasm persisted for Ōēź8 minutes after administration of scopolamine butyl bromide in approximately 14% of the population.11 Most of the patients included in the screening had historical symptoms of IBS or symptoms at the time of the examination. Accordingly, we formed a hypothesis that persistent colonic dysmotility associated with IBS can be observed during endoscopy in response to the psychological stress of the colonoscopy procedure, while dysmotility in healthy individuals is suppressed by antispasmodics.
Insertion of the colonoscope into the cecum is often difficult in patients with defecatory disorder, because of colonic morphological abnormalities, such as elongation and acute angulation.16 However, the role of colonic morphology in the pathophysiology and management of IBS is unknown. We also formed the hypothesis that some patients with IBS do not have persistent colonic dysmotility, and most of them have colonic morphological abnormalities, such as mesocolon descendens and sigmoid colon malrotation. CT colonography (CTC) is useful for excluding organic diseases and for producing a three-dimensional image of the colon.17 CTC or barium enema can reveal colonic morphology.
In the present study, we aimed to evaluate colonic dysmotility and morphology in patients with each subtype of IBS using colonoscopy in combination with CTC or barium enema, and to assess the pathophysiology of IBS.
METHODS
1. Ethical Considerations
The study protocols were reviewed and approved by the Ethics Committee of Kurihama Medical and Addiction Center (number: 151) and the Yokohama Municipal Citizen's Hospital (number: 20070910-1), Kanagawa, Japan. All study participants, or their legal guardians, provided written informed consent for unsedated colonoscopy and CTC or barium enema.
2. Participants
Between January 2008 and January 2012, we recruited 49 asymptomatic individuals without defecatory disorder who underwent colonoscopy for colorectal cancer screening, and 184 patients with IBS. We excluded patients with diabetes, liver diseases, gastrointestinal surgical history, or malignancy. After informed consent was obtained, colonoscopy in combination with CTC or barium enema was performed to evaluate colonic dysmotility and morphology. Participants were interviewed to determine their symptoms, and the diagnosis of IBS was based on the Rome III criteria.2 Although the colonoscopic evaluation was carried out at the time of performance of the colonoscopy, and patients' symptoms were recorded at the time of examination, this study was retrospectively conducted.
3. Colonoscopy
All participants underwent bowel preparation before colonoscopy. To prevent bowel spasm, scopolamine butyl bromide (20 mg) or glucagon (1 mg) was injected intramuscularly, and no sedatives were administered. All colonoscopies were performed by a single trained endoscopist (T. Mizukami), and cecal intubation time was recorded. This endoscopist was a well-trained board certified specialist of the Japan Gastroenterological Endoscopy Society with over 18 years and 18,000 cases of colonoscopy experience. All procedures were performed using water-aided colonoscopy, called the ŌĆ£collapse-submergence methodŌĆØ or ŌĆ£water-navigation colonoscopy.ŌĆØ This entailed infusion of water in lieu of air insufflation to distend the lumen during the insertion phase of colonoscopy, as previously described.12,13
4. Definition and Evaluation of Colonic Dysmotility
We recorded the duration of persistence of colonic movement after administration of an antispasmodic agent and the pattern of colonic movement in the entire colon. The endpoint of colonic movement was defined as absence of peristalsis/segmental movement over a period of 30 seconds (Fig. 1A). Persistence of colonic dysmotility for >8 minutes after administration of an antispasmodic agent was defined as colonic dysmotility.11 Patterns of dysmotility were evaluated and classified as spontaneous colonic excessive peristalsis and segmental contractions. Colonoscopic view showed spontaneous, excessive colonic peristalsis that prevented further advancement of the endoscope. Excessive colonic contraction forces stool through the colon, resulting in diarrhea (Fig. 1B). Segmental movement was defined as the combined presence of physiological retraction rings and expanded colonic lumen, and physiological retraction rings contracted and relaxed at the same point. Colonoscopic view showed colonic dysmotility with segmental features that prevented further advancement of the endoscope. The colon maintained segmental contractions, thus affecting stool transit, resulting in constipation (Fig. 1C).
5. Definition and Evaluation of Morphological Abnormality
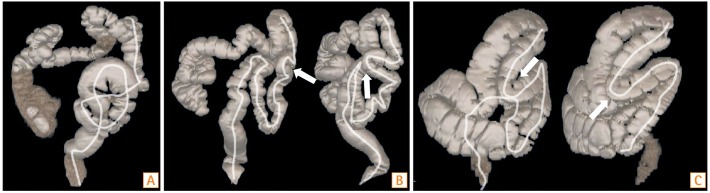
As a result of changes in the water surface and the direction of colonic rotation, colonic morphology was approximately determined using water-aided colonoscopy.15 We confirmed colonic morphology using barium enema or CTC, immediately after colonoscopic observation, with complete suction of debris and fluid in the colonic lumen. Colonic morphology around the hindgut area, such as sigmoid malrotation (Fig. 2A) and mesocolon descendens (Fig. 2B and C), was evaluated. Morphological abnormality was assessed by a single trained physician (T. Mizukami), who had the experience of performing 30 autopsies to evaluate colonic morphology in the Department of Anatomy, Keio University School of Medicine, Tokyo, Japan. The evaluation was approved by another physician (S.S.).
6. Questionnaire Regarding Related Stress
Participants with IBS were asked whether their IBS symptoms began after an episode of stress, or if they were triggered by daily mental stress.
7. Statistical Analysis
The statistical significance of any differences was analyzed using the unpaired Student t-test or Fisher exact test for two groups and ANOVA with Tukey's post hoc test for three groups, as indicated. All statistical analyses were performed using IBM SPSS version 22.0 (IBM Corp., Armonk, NY, USA). The data are expressed as means┬▒SD. Two-sided P<0.05 was considered statistically significant.
RESULTS
1. Patient Characteristics
We enrolled 184 consecutive patients with IBS (93 men and 91 women) and 49 asymptomatic controls (29 men and 20 women). Characteristics of the patients with IBS and asymptomatic controls are shown in Table 1. The mean age of the IBS group (58.9┬▒16.1 years) was significantly lower than that of the control group (61.4┬▒15.4 years) (P=0.010). There was not a significant difference in gender in either group (P=0.340). The participants with IBS consisted of 80 patients with IBS-C (37 men and 43 women), 45 with IBS-D (26 men and 19 women), and 59 with IBS-M (30 men and 29 women). No cases of unsubtyped IBS were observed. Characteristics of patients with different IBS subtypes are shown in Table 2. There were no significant age and gender differences in the IBS subtype groups (P=0.200).
2. Colonic Dysmotility
Persistence of colonic dysmotility for >8 minutes after administration of an antispasmodic agent was more frequently observed in the IBS group than in the control group (28.8% vs. 2.0%, P<0.001) (Table 1). Colonic dysmotility was more frequent in the IBS-D than IBS-C and IBS-M groups (IBS-C 28.8% vs. IBS-D 60.0% vs. IBS-M 5.1%, P<0.001) (Table 2). Most of the colonic dysmotility observed in IBS-D was excessive peristalsis (Fig. 1B), which caused incontinent excessive passing of gas or water through the anus during colonoscopy. Most of the colonic dysmotility observed in IBS-C was segmental movement (Fig. 1C), which made it difficult to advance the colonoscope through the retracted rings of the colon. Most of the IBS patients with persistent colonic dysmotility had experienced stress related to the symptoms (Table 3). In most cases, colonic dysmotility ceased after participants were informed that the endoscope had reached the cecum, the endpoint of the colon (data not shown).
3. Morphological Abnormality
Barium enema or CTC was performed in 47 and 126 participants with IBS, respectively (Fig. 3). Colonic morphological abnormality was more frequent in the IBS group than in the control group (77.7% vs. 24.5%, P<0.001) (Table 1). This morphological abnormality was more frequent in IBS-M and IBS-C than in IBS-D (IBS-C 77.5% vs. IBS-D 48.9% vs. IBS-M 100.0%, P<0.001) (Table 2). Most of the IBS patients with only colonic morphological abnormality had not experienced stress related to the symptoms (Table 3).
4. Cecal Intubation Time
No complications directly related to colonoscopy, including perforation and bleeding, were observed and no participant experienced more than tolerable pain. Cecal intubation was impossible in only one male patient with IBS-M; thus, the cecal intubation rate was 99.5% in patients with IBS and 100% in the control group. The case of incomplete intubation was excluded from calculation of the average time. Cecal intubation time was significantly longer in the IBS group than in the control group (12.1┬▒6.9 minutes vs. 4.6┬▒1.9 minutes, P<0.001) (Table 1). There was no significant difference in cecal intubation time among the IBS subgroups (IBS-C 12.7┬▒8.0 minutes vs. IBS-D 10.7┬▒1.9 minutes vs. IBS-M 12.3┬▒5.9 minutes, P=0.300) (Table 2).
DISCUSSION
We demonstrated that persistent colonic dysmotility after administration of an antispasmodic agent and morphological abnormality were more frequent in patients with IBS than in asymptomatic controls. These abnormalities made colonoscope insertion difficult, and cecal intubation time was significantly longer in the IBS group than in the control group.
IBS is a functional gastrointestinal disorder with a high prevalence that has a considerable impact on quality of life.1 It is crucial to perform correct diagnosis of IBS and initiate appropriate management immediately.2,18 There are few pathognomonic tests for IBS; therefore, it is a challenge for clinicians to differentiate IBS from other gastrointestinal disorders objectively. Visceral hypersensitivity and hyperalgesia play important roles in the pathophysiology of IBS.19,20 Examinations of gastrointestinal function, such as colonic manometry, anorectal manometry, measurement of gastrointestinal transit, or colorectal barostat, are useful to support the diagnosis of IBS and differentiate it from other functional gastrointestinal disorders. However, these examinations are still unavailable in most hospitals and are difficult to perform routinely.19
Colonoscopic examination is necessary to rule out colorectal cancer, IBD, and colon diverticular diseases among patients with IBS symptoms. Age >50 years and warning signs such as anemia and weight loss require colonoscopic examination to distinguish these organic diseases from IBS.2,19 Some researchers have attempted to establish a difference in pain perception during colonoscopic examination between individuals with and without IBS.5,21,22 Cullingford et al.21 reported that the intensity of pain during colonoscopic examination was higher in patients with IBS than in patients without IBS, suggesting that pain is a useful tool for diagnosing IBS. Most of the pain and discomfort experienced during colonoscopy are caused by stretching of the mesentery from the loop at the sigmoid colon, distension of the colonic wall by over-insufflation, and the perception of pain.5 High sensitivity to colonic stretching in IBS is attributed to peripheral sensitization of mechanoreceptors and abnormal central processing of visceral sensory information.23 Kim et al.5 used the difference in pain, experienced between individuals with and without IBS to evaluate the visceral hypersensitivity of IBS. They concluded that colonoscopy could be a diagnostic tool for identifying IBS caused by visceral hypersensitivity to colonoscopy and colonic spasms.
We have reported a technique for colonoscope insertion without sedation.12,13,14,15 In this technique, 200 mL of water is infused at the rectosigmoid and complete air suction is performed from the rectosigmoid. This forces the flow of water to the descending colon, and the rectosigmoid straightens and shortens by itself. A ŌĆ£corkscrewŌĆØ twist of the colonoscope in accordance with the twist of the sigmoid colon allows the colonoscope to proceed to the descending colon without looping.12 During intubation, the surface of the water and twisting of the colon indicate the colonic morphology.15 This technique causes minimal change in colonic volume and only slightly stretches the sigmoid colon, which makes it possible to perform colonoscopy without sedatives.12 In recent years, a water-aided colonoscopy technique similar to ours has been developed to reduce pain during nonsedative colonoscopy,24,25 and it can be used therapeutically for sigmoid volvulus.26,27
In the present study, persistence of colonic dysmotility for >8 minutes after administration of an antispasmodic agent was more frequently observed in patients with IBS than in controls. The persistent colonic dysmotility observed among patients with IBS-D was excessive peristalsis that caused excessive passing of gas and water through the anus, which could not be controlled by patients. The persistent colonic dysmotility observed among patients with IBS-C was segmental movement that was caused by a combination of retraction rings and expanded colonic lumen. The retraction rings contracted and relaxed at the same point, which caused a sensation of bloating. Most patients were aware that their IBS symptoms were caused by mental stress. Colonic dysmotility appeared to be caused by mental stress associated with the colonoscopy procedure, and it ceased upon the administration of sedatives or at the time when the endoscope reached the cecum. This dysmotility may explain the IBS symptoms such as diarrhea and constipation evoked by mental stress.
Colonic morphological abnormality was more frequent in the IBS group than in the control group. Abnormalities such as sigmoid colon malrotation and mesocolon descendens cause acute angulation and elongation of the colon, which lead to difficulties with colonoscope insertion.15,28,29 In the present study, colonic morphological abnormality was frequent in the IBS-M and IBS-C subgroups, and most of the patients were not aware of any mental stress causing their IBS symptoms. Insertion of the colonoscope into the cecum is often difficult in patients with colonic morphological abnormality, and most patients are aware of tolerable pain or discomfort, which is similar to their IBS symptoms, when the colonoscope passes the area of colonic morphological abnormality.
Cecal intubation time was significantly longer in the IBS group than in the control group. Difficulty with cecal intubation caused by colonic dysmotility and/or colonic morphological abnormality suggests that these defects could cause defecatory disorder and pain in IBS. It is possible that this classification of IBS contributes to the potential to select the appropriate management for each patient. In addition, patients with IBS involving morphological abnormality and/or colonic dysmotility were frequently convinced by our explanation of their symptoms using colonoscopic findings and/or CTC images, resulting in biofeedback.
Although the present study seems to present an attractive endoscopically and radiographically novel method of evaluation of IBS, it has several limitations. This study was a retrospective study, and consecutive patients with IBS who were scheduled to undergo colonoscopy were recruited; thus, the patients might not be representative of the general population in terms of demographic characteristics such as age and sex. It was also difficult to enroll asymptomatic young participants, while patients aged >50 years were more likely to undergo colonoscopy for colorectal screening. However, the morphological features depend on anatomical factors; thus we think the effects of age on colonic morphological abnormality may be relatively small.17 Although colonic morphology was assessed using CTC or barium enema, unified assessment was desirable. Since a single endoscopist assessed colonic dysmotility, and the commencement of the effect of antispasmodic agents varies among patients, the method of colonic dysmotility evaluation may be relatively subjective. The incidence of colonic morphological abnormality varies worldwide.30 Our study was an assessment of IBS in the Japanese population, thus there may be geographical differences.31 Of course, our conception in this study cannot explain all of the pathophysiology of IBS.
In conclusion, we suggest that there are some patients with IBS involving colonic dysmotility and/or morphological abnormality. These abnormalities manifested as technical difficulties with cecal intubation may partially explain the pathophysiology of IBS. Unsedated colonoscopy combined with radiographic findings is useful for excluding organic colonic disease, as well as for functional evaluation in patients with IBS.