


INTRODUCTION
Colorectal cancer (CRC) is one of the major causes of cancer-related mortality worldwide, including African countries.1,2 CRC caused about 694,000 deaths in 2012 alone, with >1.4 million new incidences globally.2,3 The records from Ahmadu Bello University Teaching Hospital in Zaria, Nigeria, show that CRC is the 2nd most prevalent type of cancer in men and the third in women, and has a poor prognosis owing to its late presentation. The incidence rate of CRC has been previously reported to be much lower in developing countries than in high-income nations.4,5 CRC is reported to occur more frequently in African Americans than in rural Africans. CRC is also reported to be associated with a much lower 5-year overall survival rate in African Americans than in Caucasians.5
The high incidence of CRC in developed nations is attributed to lower dietary fiber consumption and higher animal protein and fat intake, which contribute to lower levels of short-chain fatty acid and increased levels of secondary bile acids in the colon.5,6 Accumulating evidences have suggested that the components of short-chain fatty acids (acetate, propionate, and butyrate), which constitute 3% to 9% of human daily caloric intake, play several key roles in the prevention of CRC.7,8,9,10 Secondary bile acids, such as deoxycholic and lithocholic acids, induce tumorigenesis in the bowel.7,8 Accumulation of deoxycholic acid in the bowel promotes mucosal and DNA damage, and has been associated with increased reactive oxygen species, which play a role in colorectal carcinogenesis.11 The conjugation, deconjugation, and modification of dietary fiber by fecal bacteria in the bowel are hypothesized to contribute to the production of secondary bile acids.8 This explains why colonic microbial metabolites including acetaldehyde from ethanol or ammonia, and polyamines and hydrogen sulfide produced from dietary fiber and protein components may increase the risk of colorectal carcinogenesis.6 However, notably, certain secondary bile acids that have been shown to be beneficial to health may also inhibit the growth of pathogenic colonic bacteria. This study reports the findings on dietary fiber intake, fecal fiber components (neutral detergent fiber [NDF], acid detergent fiber [ADF], cellulose, hemicellulose, and lignin), and fecal pH level in patients with CRC and a control group from rural Africa (Zaria, Nigeria).
METHODS
1. Ethical Statement
This study was reviewed and approved (MOH/ADM/774/VOL1/340) by the Health Research Ethics Committee of the Ministry of Health and Human Services Kaduna State, Nigeria. Informed consent was obtained from all subjects before their recruitment for the research.
2. Subject Recruitment and Study Period
This study did not receive specific funding from any funding agency in the public, commercial, or not-for-profit sector. The lack of funding limited our sample size to a convenience sample of 35 subjects comprising 21 patients with CRC and 14 controls. The subjects were recruited at the Ahmadu Bello University Teaching Hospital, Zaria, Nigeria. The eligibility criteria were a confirmed histological diagnosis of CRC for the patient group and willingness to perform the study requirements for the matched control subjects. The exclusion criteria were gastrointestinal bleeding, diagnosis of adenomatous polyps, and IBD. Patients with CRC who were exclusively unable to pass stool were also excluded from this study. The study was carried out from June 1, 2010, to December 31, 2011.
3. Dietary Fiber Assessment
At baseline, the dietary information of the subjects was updated through careful consideration of the variety of rural African foodstuffs, especially in the sub-Saharan part of Africa, by using an extended version of a truncated semi-structured Food Frequency Questionnaire (FFQ) (Supplementary Material 1). In each of the truncated FFQ, there is a brief section for demographic survey. The subjects were also asked to provide information on how often, on average, a food of a standardized portion size was consumed during the previous weeks or over time. Three major response options with predefined frequency categories ranging from ŌĆ£neverŌĆØ to ŌĆ£Ōēź4 times/wkŌĆØ for intake of beverages, and ŌĆ£neverŌĆØ to ŌĆ£Ōēź3 times/wkŌĆØ for intake of whole grain wheat, cereal, or vegetable were used. Questionnaire items about fish and meat consumption were also considered. Research assistants facilitated the completion of the FFQs to reduce bias.
4. Fecal pH Analysis
Small fecal samples directly obtained from the subjects were placed in sterile stool containers (Celltech Diagnostic, Hamburg, Germany). The containers with the stool samples were packed on ice and transferred to the laboratory immediately. The stool samples were mixed by stirring with a sterile wooden spatula. A pH meter that was calibrated with buffers of pH 4 and 7 was used to immediately measure the stool pH. The pH meter was thoroughly washed during intervals and recalibrated to avoid contamination and false-positive results.
5. Analysis of Fecal Fiber Components (NDF, ADF, Cellulose, Hemicellulose, and Lignin)
Fecal sample analysis of the groups was performed using validated Goering and Van Soest12 procedures for the determination of total NDF, ADF, hemicellulose, cellulose, and lignin contents.13 The methods were validated by food science professionals in the Department of Food Science, Institute for Agricultural Research, Ahmadu Bello University, Samaru Zaria, Nigeria.
All stool samples were homogenized and lyophilized with a freezer dryer (LGJ-12; Beijing Songyuan Huaxing Technology, Beijing, China). The lyophilized samples were stored in a sterile stool container to avoid absorption of moisture from the environment. About 1 g of each sample was extracted with 50 mL mixture of ethanol/ether (3:1 v/v) at 55Ōäā to 60Ōäā in water bath for 1 hour with intermittent steering. The suspension was centrifuged at 4000 rpm for 30 minutes. The supernatant was decanted and the defatted residue was dried. The dried sample was transferred quantitatively to a beaker with a refluxing apparatus containing 100 mL neutral detergent solution, and refluxed gently for 1 hour after adding 2 mL decalin (BDH-28007) and 0.5 g sodium sulfite. The content was then transferred to a 150-mL centrifuge tube and centrifuged at 4000 rpm for 15 minutes. The supernatant was passed through a previously weighed sintered funnel (porosity 1) with mild suction. The beaker of the refluxing assembly was rinsed several times with boiling water to avoid contamination. After several washings of the residue in the centrifuge tube as above, the residue was transferred quantitatively to a funnel containing acetone. Washing with (CH3)2CO was repeated in sintered funnel, and the residue was dried to constant weight at 100Ōäā to determine the NDF content.
For the determination of ADF content, a crucible containing the NDF was placed in a flask and refluxed from the onset of boiling with 100 mL acid detergent solution. The content of the flask was filtered with suction pump and the residue was washed with acetone. The crucible was dried overnight in an oven at 100Ōäā and weighed hot. The loss in weight of the neutral detergent residue represented the ADF content.
The hemicellulose content of the fecal sample was determined by taking the difference in NDF and ADF contents. The lignin content of the stool sample was determined by placing the crucible containing acid detergent residue in an enamel pan and treated for 90 minutes with a single 25 mL portion of 0.1 N permanganate (MnO4ŌłÆ) solution. The mixture was stirred with a glass rod to wet all particles. The remaining MnO4ŌłÆ was aspirated from the residue and washed with hot distilled water, CH3CH2OH, and (CH3)2CO. The crucible was dried overnight at 100Ōäā in an oven and weighed hot. The loss in weight of the acid detergent residue provided the estimate of fecal lignin. For the determination of fecal cellulose content, the crucible containing the residue from the MnO4ŌłÆ treatment was placed in an enamel pan half-filled with 72% sulfuric acid (H2SO4 [BDH-7664-93-9]), and the mixture was stirred with a glass rod to wet all particles. The crucible was replenished with H2SO4 at an hourly interval. After 3 hours, the remaining sulfuric acid was removed through suction and the residue was thoroughly washed with hot distilled water. The crucible was dried in an oven at 100Ōäā overnight and weighed hot. The lost in the weight of the MnO4ŌłÆ residue provided the estimate of the cellulose content.
6. Statistical Analysis
Because of the small number of subjects, we determined the power of the sample, while taking into consideration the predetermined sample size, toward detecting the differences in fecal fiber components and the stool pH levels from the subjects. Statistical analysis was carried out using the SPSS software, version 20.0 (IBM Corp., Armonk, NY, USA). The mean fecal NDF, ADF, hemicellulose, lignin, and cellulose contents (individual and total) and the stool pH levels were compared by using ANOVA. In addition, the mean fecal fiber components and the stool pH for patients with CRC and the matched control group were compared using independent sample t-test. A P-value of <0.05 was considered statistically significant. For the demographic and other analyses, simple percentages were utilized in Microsoft Excel (Microsoft Office Professional Plus 2013; Microsoft Corp., Redmond, WA, USA) to produce simple clustered column charts.
RESULTS
The subjects' characteristics are listed in Table 1. Thirty-five subjects with a male-to-female ratio of 1.5:1 completed the FFQ survey and submitted a stool sample for analysis. We did not find any significant relationship of smoking, family history of cancer, and educational background when comparing the patients with CRC and the matched control group (P>0.05). However, there was a significant difference in the residential environment and monthly income between patients with CRC and the control group (P<0.05) (Table 1). It should be noted that as this research is only a report of a pilot study, obesity factors including BMI of the recruited subjects were not analyzed.
1. Comprehensive Analysis of Dietary Fiber-Rich Foodstuff Intake
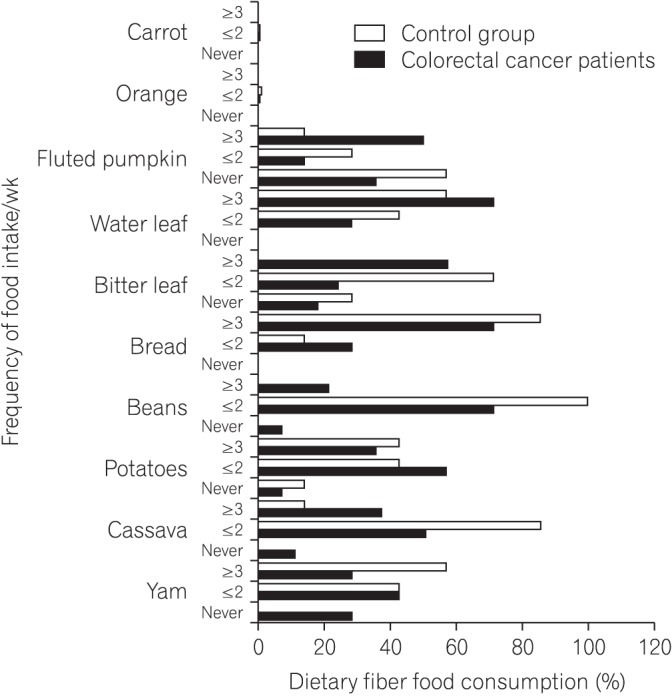
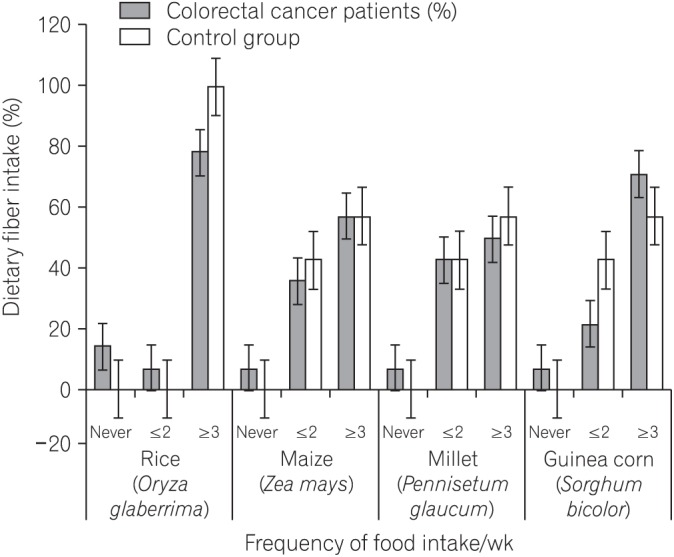
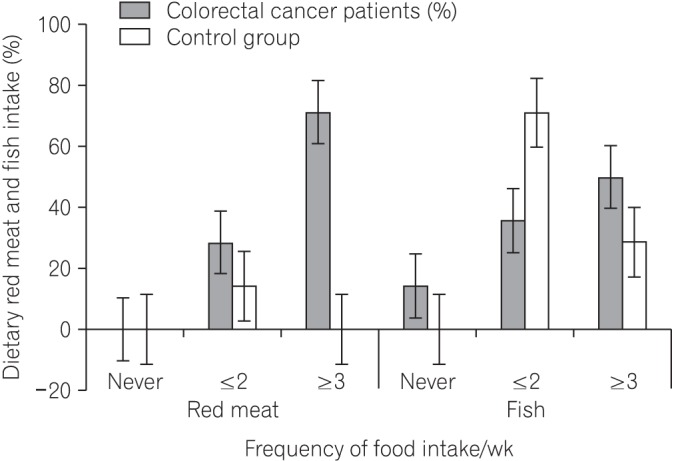
Considering the patients with CRC and the matched control group, the dietary FFQ showed significant differences in the intake of foodstuffs rich in soluble fiber including yam (P=0.0042), cassava (P=0.0001), potatoes (P=0.0101), bread (P=0.0001), bitter leaf (P=0.0478), water leaf (P=0.0047), fluted pumpkin (P=0.0001), and carrot (P=0.0001) (Table 2). Fig. 1 shows the differences by including dietary fiber foodstuffs not included in Table 2. Significant differences in the intake of guinea corn (Sorghum bicolor) were also observed between patients with CRC and the control group (P=0.0002) (Table 3, Fig. 2). There was also a significant difference in the intake of red meat and fish products between patients with CRC and the matched control group (P<0.05) (Table 4, Fig. 3).
2. Fecal NDF, ADF, Hemicellulose, Cellulose, and Lignin Contents from Stool Samples of Subjects
In one-way ANOVA, there were significant differences in fecal NDF (P=0.0001), ADF (P=0.0001), hemicellulose (P=0.0067), lignin (P=0.0188), and cellulose (P=0.0015) contents, either individual or total, between patients with CRC and the control group (Table 5).
3. Results of Fecal pH Level of Patients with CRC and Controls
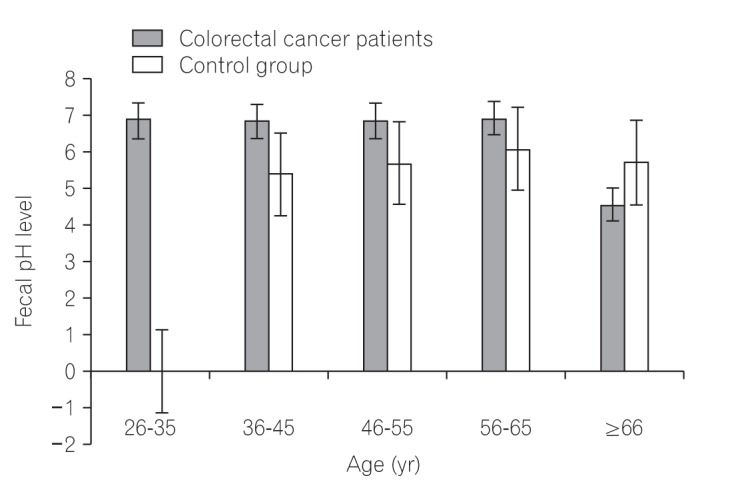
Table 6 lists the one-way ANOVA results, showing a statistically significant difference in fecal pH levels between patients with CRC and the control group (P=0.017). In addition, we identified no statistically significant difference in fecal pH when comparing the differences in age of each group independently (P>0.05) (Tables 7 and 8). Fig. 4 depicts the variation in the fecal pH level when comparing the 2 groups, taking into consideration the age differences.
DISCUSSION
The present study considered the dietary fiber intake; fecal cellulose, hemicellulose, and lignin contents; and stool pH of patients with CRC and a control group in Zaria, Nigeria. The incidence of CRC was insignificant in Africa a few decades ago; however, recent studies have shown a steady yearly increase, with accompanying late presentation and high mortality rate of the disease.4,14 Although diet and genetic predisposition are crucial determinants of CRC risk, the demographic data from our study show that 100% of patients with CRC had no family history of the disease. From the result, only 19% of patients with CRC were cigarette smokers and 14% were alcohol drinkers. About 47% of patients with CRC had higher education. Leufkens et al.15 reported that the risk of CRC is higher in patients with advanced education than in those with lower educational background. There were significant differences in the residential environment and approximate monthly income between patients with CRC and the matched control group (P<0.05) (Table 1). The results showed that 52% of patients with CRC reside in rural areas, whereas 48% are from urban areas. This indicates that CRC may not be affected by the residential environment (rural or urban) in Africa. Interestingly, more patients with low monthly income were affected by CRC than those with high monthly income (Table 1).
The truncated predefined FFQ showed an increased frequency of consumption of dietary fiber-rich African foodstuffs in both groups. A transition to Western dietary and lifestyle practices, which are associated with CRC, might have resulted in a significant negative influence on rural Africans if not for the poor economic situation in the African continent. There were significant differences in the intake of foodstuffs rich in soluble fiber, including yam (Dioscorea alata), cassava (Manihot esculenta), potatoes (Solanum tuberosum), bread, bitter leaf (Vernonia amygdalina), water leaf (Talinum triangulare), fluted pumpkin (Telfairia occidentalis), orange (Citrus sinensis), and carrot (Daucus carota) between patients with CRC and the matched control group (Table 2). Fig. 1 elaborates the differences by including foodstuffs rich in dietary fiber not included in Table 2. Significant differences in the intake of guinea corn (S. bicolor) were also observed between patients with CRC and the control group (P<0.05) (Table 3). Improved intake of fruits, vegetables, unrefined grains, poultry, and fish, and reduced intake of red meat and animal protein have been reported to be positively associated with a lowered risk for CRC.15 Dietary fiber consumption is associated with decreased incidences of CRC through 2 mechanisms: physiological and molecular. The physiological mechanism involves increase in non-harmful colonic bacteria and decrease in harmful colonic bacterial metabolites; detoxification through binding of mutagens and promutagens; formation of short-chain fatty acids in the lumen; lowering of fecal pH level; increase in bowel viscosity; and dilution and fecal bulking, resulting in improvement of fecal quality, quantity, and reduced transit time, which make the colonic environment favorable for the growth of non-harmful bacteria.9,10 The cellular mechanism pathways include butyrogenesis, which plays an important role in the modulation of the expression of genes associated with antitumor activity and removal of damaged DNA from colonic cells.
Three times weekly intake of rice was found in 78% and 100% of patients with CRC and the control group, respectively. A previous report documented that increased rice intake plays an important preventive role against CRC development.16 Wheat and rye fiber have been reported to be rich sources of cellulose and contribute to lowering fecal bile acid concentration, and also play a role against CRC risk.17 The preventive role of dietary fiber-rich foodstuffs against the risk of malignancy has also been reported to be significant in rectal cancer but not colon cancer.18 A report by Uchida et al.16 indicated that intake of nonrice cereals increases the CRC risk. In addition, a study of 73,501 subjects by Abe et al.18 documented no significant association of rice, bread, noodle, and cereal consumption with CRC risk. Our results also showed a high frequency of bread consumption by both groups. Bread is reported to contain maillardized insoluble dietary fiber, which is a polyphenolic compound19 that is important against CRC risk. However, Skeie et al.20 believe that intake of whole grain do not improve overall survival in patients with CRC. Our findings also showed a significant difference in the intake of red meat between patients with CRC and the matched controls (P=0.0001). Increased intake of red meat was reported to be associated with the risk of colonocyte DNA damage,21 and this may be one of the possible contributing factors to the steady increase in the CRC incidence in Africa, especially in Zaria, Nigeria. In this African environment, red meat in the form of smoked, roasted, fried, cooked, dried, and curried meat are consumed in significant proportions. There was also a significant difference in the intake of fish between patients with CRC and the control group (P=0.0001) (Table 4). Reports have shown that consumption of fish together with oils rich in omega-3 polyunsaturated fatty acids from fish plays an important preventive role against CRC risk.22,23
The mean averages of the fecal NDF (0.380┬▒0.055 g) and ADF (0.260┬▒0.045 g) contents in patients with CRC were decreased, whereas those in the matched apparently healthy control group (NDF, 0.470┬▒0.061 g and ADF, 0.340┬▒0.043 g) were increased. Rodr├Łguez-Romero et al.24 showed that NDF reduces fecal digestibility and promotes fermentation in the caecum. The results from our study showed that the mean averages of fecal hemicellulose (0.110┬▒0.017 g) and cellulose (0.090┬▒0.015 g) contents in patients with CRC was lower than those in the control group (0.130┬▒0.024 and 0.110┬▒0.019 g). Hemicellulose is reported to be an important source of xylooligosaccharides, arabinoxylans, arabinogalactans, and ╬▓-glucan, which serve as good substrates for colonic bacteria.25 Bacteroidetes and Firmicutes from the microbes that colonize the human bowel play important roles in the metabolism of dietary fiber.26 Cellulose and hemicellulose are degraded by the Lachnospiraceae and Ruminococcaceae families of bacteria in the lumen to produce short-chain fatty acids.27 The Lachnospiraceae and Ruminococcaceae bacterial families have been reported to be associated with healthy and malignant colonic cells, respectively.28 About 56% to 87% of the total dietary hemicellulose and 29% to 82% of dietary cellulose are reported to be lost with stool.29 Cellulose in the lumen has been reported to prevent 1,2-dimethylhydrazine-induced colorectal carcinogenesis in rats.30 The protective role of cellulose against colorectal carcinogenesis is through the binding and inhibition of bile acids and cellular DNA damage, respectively.17 A high concentration of secondary bile acids in the lumen promotes genomic instability, leading to CRC.31,32
The mean average fecal lignin (0.130┬▒0.019) content in patients with CRC was decreased compared with that in the matched apparently healthy control group (0.150┬▒0.029). Lignin contains polymeric cross-linked structural features, which make it more resistant to bacterial digestion; thus, lignin is almost entirely excreted with stool.29 Lignin is a rich source of syringaldehyde, furfural, coumaric, and ferulic acids,33 which stimulate the fecal excretion of secondary bile acids and the absorption of carcinogens in the bowel.34
The mean average of the fecal pH showed a significant increase in patients with CRC (6.722┬▒0.814) compared with the matched apparently healthy control group (5.717┬▒0.874). This is in agreement with the findings from other studies that indicated high fecal pH level to be associated with CRC risk.18,35 The increase in the fecal pH in patients with CRC has been associated with lower levels of short-chain fatty acids.36 Beneficial colonic bacteria such as Lactobacillus and Bifidobacterium species, which release short-chain fatty acids as fermentation substrate, contain important anticarcinogenic properties and reduce the CRC risk in the bowel.5,35,36,37 The short-chain fatty acids include acetic, butyric, propionic, and valeric acids, and they play roles in epigenetic functions and tumor-suppressive activities.37 In addition, increased concentration of butyric acid is associated with anti-inflammatory and immunomodulatory effects, as well as regulation of Wnt signaling pathway in CRC.38 Butyric acids in the lumen are less metabolized by cancer cells and accumulate to serve as histone deacetylase inhibitors, and also epigenetically controls gene expression and induce apoptotic cell death.36,39 Colonic butyrates are also broken down in the mitochondria to stimulate cell proliferation.39
About 90% of all patients with CRC presented a fecal pH level of 6.7 to 7.0, whereas 100% of the control group showed a fecal pH of about 5.4 to 6.0. Our result is in agreement with that of other studies that documented that the fecal pH level of patients with CRC was within 6.1 to 7.3.40 Other studies also reported fecal pH values of 7.4┬▒0.8 and 6.9┬▒0.6 in CRC and non-CRC groups, respectively.36 Increased intake of meat and sugar products results in increased fecal pH level and CRC risk.41 Diet rich in red meat and sugar products is associated with an increased expression of the baiCD gene, a stool microbial gene that encodes for 7╬▒-dehydroxylating enzyme during deconjugation of bile acids, and contributes to colorectal carcinogenesis.5 However, the hemicellulose content in corn has been reported to contribute to lowering the fecal pH level.11
The limitation of this pilot study includes its small sample size resulting from the lack of adequate funding for cancer research in Africa, especially in the sub-Saharan Africa region. We were also unable to quantify the exact dietary fiber consumption of the subjects in grams over a long period.
The results presented by this pilot study identified a variation in the fecal fiber components (hemicellulose, lignin, and cellulose) and fecal pH levels between the 2 groups. These variations, together with other findings in this study, may have a significant impact on the colonic environment, leading to long-term CRC risk in rural Africans. As our findings are from a limited pilot study, further studies should have a larger sample size and analyze the obesity factors in patients with CRC, because obesity has been associated with the gastrointestinal microbiome, thereby influencing the fecal metabolome and fecal pH. In addition, more research with a large-scale longitudinal approach is needed to reach a valid conclusion on the status of dietary fiber and/or dietary polyphenols in rural Africa today. This may pave the way for interventional preventive measures against CRC in Africa and beyond.