


INTRODUCTION
Crohn's disease (CD) and UC are the two main forms of chronic IBD, characterized by remitting and relapsing inflammation of the bowel. As with other complex diseases, both genetic susceptibility and environmental factors appear to be involved in the pathogenesis of IBD. Accumulating evidence suggests that IBD results from an inappropriate and continuing inflammatory response to intestinal microbes in genetically susceptible hosts.1
To date, genome-wide association studies (GWASs) and meta-analyses of IBD have identified 140 CD-susceptibility loci and 47 UC-susceptibility loci, including 28 that are shared between CD and UC.2,3,4,5,6 Of these, the tumor necrosis factor (TNF) superfamily member 15 (TNFSF15) variant contributes to CD susceptibility in European,7 Japanese,7,8 and Korean populations.9
TNFSF15 is abundantly expressed, primarily in endothelial cells,10 and is a ligand for receptors such as the TNF receptor superfamily member 25 (TNFRSF25).11 Its expression has been shown to be highly inducible by TNF╬▒ and interleukin-1-╬▒. It also activates nuclear factor (NF)-╬║B and induces apoptosis in TNFRSF25-expressing cell lines.11 Because TNF-╬▒ is a proinflammatory cytokine that plays a key role in the immunopathogenesis of IBD, it seems reasonable to suspect that TNFSF15 genotypes may play an important role in the pathogenesis of CD.
Similarly, although it has not been investigated in IBD, protein kinase C, delta-binding protein (PRKCDBP , also known as Cavin3/hSRBC) is a novel candidate gene in IBD. Originally, Izumi et al.12 isolated a protein kinase C-binding protein, the expression of which was induced by serum starvation. PRKCDBP was recently identified as a proapoptotic tumor suppressor, located at chromosomal region 11p15.5-p15.4.13,14 We reported that PRKCDBP induces cell cycle arrest and apoptotic cell death by enhancing the protein stability of p53.14 Consistent with these findings, loss or reduction of PRKCDBP expression due to aberrant promoter CpG site hypermethylation has been observed in many malignancies, including colorectal cancer.13,14,15 Interestingly, we found that PRKCDBP transcription is activated directly by NF-╬║B signaling in response to TNF-╬▒, which plays a key role in colonic inflammation and tumorigenesis, and its inactivation contributes to tumor growth and increased resistance to TNF-╬▒ induced apoptosis.16 Moreover, our recent study demonstrated that colonic mucosal expression of PRKCDBP correlates strongly with TNF╬▒ expression in UC patients.17 These observations suggest that PRKCDBP may play a role in colonic inflammation, and its dysregulation may be implicated in the pathogenesis of IBD.
The PRKCDBP gene has more than 30 intraexonic single nucleotide polymorphisms (SNPs) leading to amino acid substitutions. To our knowledge, only one reported study has evaluated the contribution of the PRKCDBP genotype to endometrial carcinogenesis.18 To explore the possible association of SNPs in PRKCDBP with the development of IBD, we conducted a case-control study for four representative intraexonic SNPs (rs35301211, rs11544766, rs12294600, and rs1051992) based on their reported heterozygosity rates in Asian populations.
METHODS
1. Study Subjects
In total, 170 UC patients, 131 CD patients, and 100 unrelated healthy controls were included in this case-control study from May 1998 to January 2008. Blood samples were obtained from all subjects in EDTA-coated tubes. All subjects were Koreans, unrelated, over 18 years of age, and with no family history of IBD. Clinical data were obtained by detailed reviews of case records. All patients were diagnosed at the Department of Gastroenterology, Kyung Hee University Hospital, Seoul, Korea, on the basis of clinical, radiological, endoscopic, and histopathological findings according to conventional criteria. Disease phenotypes were defined following the Vienna classification19 for disease location and type of disease (penetrating, structuring, or inflammatory) in CD. UC patients were classified according to the location and extent of the inflammatory lesions (proctitis, left-sided colitis, or pancolitis). Healthy controls were volunteers without a family history of IBD. They had no gastrointestinal symptoms, took no regular medication, and had no other diseases. The study was conducted in accordance with the Declaration of Helsinki, and all subjects provided informed consent.
2. SNPs
The human genome database (http://www.ncbi.nlm.nih.gov/sites/entrez) shows that the PRKCDBP gene has more than 100 intragenic SNPs, 36 of which are missense changes causing to amino acid substitutions. We chose four representative intraexonic SNPs, rs35301211 (G210A), rs11544766 (G237C), rs12294600 (C797T), and rs1051992 (T507C) based on their reported heterozygosity rates in Asians and the National Center for Biotechnology Information database (http://www.ncbi.nlm.nih.gov/projects/SNP/snp_ref.cgi?geneId=112464).20
3. Extraction of Genomic DNA
Genomic DNA was extracted from blood lymphocytes by standard methods. Briefly, blood lymphocytes were incubated with an extraction buffer containing 1 M KCl, 1 M MgCl2, 1% Tween 20, 1% Nonidet P-40, and 2.5 ┬Ąm/mL proteinase K, at 55Ōäā for 1 hour. Proteinase K was inactivated by heating at 95Ōäā for 10 minutes and the supernatant containing genomic DNA was stored at -20Ōäā. The concentration of the extracted DNA was determined by spectrophotometric measurements.
4. PCR Amplification of Gene Regions Including SNPs
To determine the genotypes of the SNPs in patients and healthy controls, the gene regions including each SNP were separately amplified by PCR using primers SRBC210-1 and SRBC210-2 for G210A, SRBC237-1 and SRBC237-2 for G237C, SRBC507-1 and SRBC507-2 for T507C, and SRBC797-1 and SRBC797-2 for C797T (Table 1). For restriction enzyme digestion assays of the PCR products, one nucleotide around the 3' end of SRBC210-2 and SRBC797-1 was replaced with a non-complementary nucleotide to generate the recognition site for SphI and BtsI. PCR was performed with 200 ng of genomic DNA as a template for 38 cycles of 95Ōäā for 1 minute, 60Ōäā for 0.5 minute, and 72Ōäā for 1 minute in 1.5 mM MgCl2-containing reaction buffer (PCR buffer II; Perkin Elmer-Cetus, Norwalk, CT, USA). PCR products (10 ┬ĄL) were resolved on 2% agarose gels, stained with ethidium bromide (0.5 ┬Ąg/mL in 1X TBE), visualized using ultraviolet light, and photographed.
5. RFLP Analysis
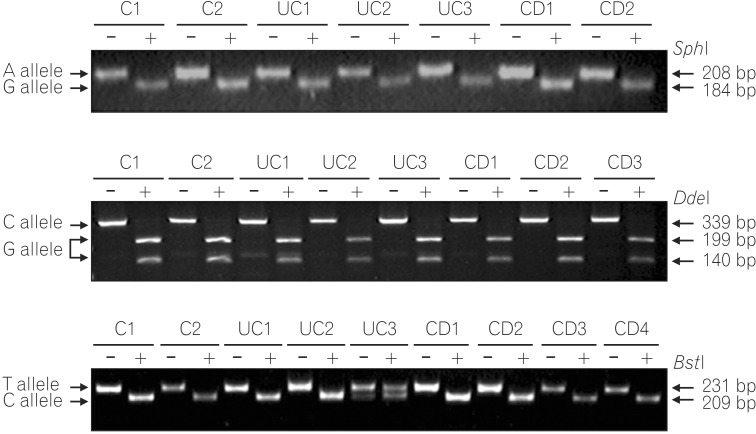
PCR products (10 ┬ĄL) were digested with the restriction enzymes SphI (GCATGŌåōC, SNP is underlined) for G210A, DdeI (CŌåōTNAG) for G237C, BtsI (ŌåōCACTGC) for C797T, and PvuII (CAGŌåōCTG) for T507C overnight at 37Ōäā, according to the manufacturers' recommendations. The PCR products digested by each restriction enzyme displayed two fragments as follows: SphI digestion of a G allele (184 bp and 24 bp), DdeI digestion of a G allele (199 bp and 140 bp), BtsI digestion of a C allele (209 bp and 22 bp), and PvuII digestion of a T allele (167 bp and 32 bp). The restriction digest products were analyzed using electrophoresis on a 2.0% agarose gel.
6. Single-Strand Conformation Polymorphism (SSCP) Analysis
To confirm the results of the PCR-RFLP assays, SSCP analysis was performed using the same PCR products. Briefly, PCR products (20 ┬ĄL) were mixed with 5 ┬ĄL of 0.5 N NaOH, 10 mM EDTA, and 10 ┬ĄL of denaturing loading buffer (95% formamide, 20 mM EDTA, 0.05% bromophenol blue, and 0.05% xylene cyanol). After heating at 95Ōäā for 5 minutes, samples were loaded rapidly into wells pre-cooled to 4Ōäā and run simultaneously on two 8% non-denaturing polyacrylamide gels with and without 10% glycerol. These two gels were then run at 18-20Ōäā and this was repeated at 6-10Ōäā in a buffer-jacketed gel apparatus (DGGE-II; Aladin Enterprises, Inc., San Francisco, CA, USA). Following a 4-hour run at 460 volts, the gels were stained with ethidium bromide and photographed under ultraviolet light. The PCR-RFLP assay and SSCP analysis yield identical results.
7. DNA Sequencing Analysis of PCR Products
PCR products showing different SSCP patterns were subjected to DNA sequencing analysis to verify the polymorphisms present. Cloning of the PCR products for sequencing analysis was performed using the TA cloning kit (Invitrogen, San Diego, CA, USA), and at least three clones showing identical SSCP abnormalities were selected and sequenced. Sequencing was performed in both directions to confirm the findings.
8. Statistical Analysis
The chi-square test was used to assess any deviation from Hardy-Weinberg equilibrium of the PRKCDBP polymorphisms in the patients and controls. The genotype frequencies were expressed as percentages of chromosomes containing a variant allele. The association between IBD patients and healthy controls was examined by comparing allele and genotype frequencies in different subject groups using a chisquare test. Allelic frequencies were compared with patients and controls using logistic regression analysis to calculate age- and gender-adjusted OR (aOR) and 95% CIs. A P-value of less than 0.05 was considered to indicate statistical significance. The strength of association was estimated by the OR. Data were analyzed using SPSS (ver. 13.0 for Windows; SPSS, Inc., Chicago, IL, USA).
RESULTS
1. Characteristics of the Study Population
Demographic and clinical characteristics of the study subjects are summarized in Table 2. In total, 170 UC patients, 131 CD patients, and 100 healthy controls were enrolled. CD patients were younger than healthy controls (P<0.001) and UC patients were older than healthy controls (P=0.003). The male-to-female ratio of CD patients was significantly higher than that of the other groups. According to extent of disease, ileocolic disease in CD (66.4%) and proctitis in UC (38.2%) were most common. The genotype frequencies in UC and CD patients and controls conformed to the Hardy-Weinberg equilibrium (P>0.05, data not shown).
2. Infrequent Sequence Variation at G210A, G237C, and C797T in a Korean Population
PCR-RFLP analysis of G210A SNP displayed only digested PCR fragments (G allele) from all 170 UC, 131 CD patients, and 100 healthy individuals, indicating no sequence variation at this site (Fig. 1A). Genotype analysis of the G237C SNP detected a GT heterozygote configuration in only one CD case, and all other patients and healthy individuals showed the GG homozygote configuration (Fig. 1B). Similarly, genotype analysis of the C797T SNP identified a CT heterozygote configuration from two CD, two UC patients, and two healthy controls. All other patients and healthy controls had the CC genotype (Fig. 1C).
3. Association Between T507C SNP and IBD Development
In contrast to the G210A, G237C, and C797T SNPs, the T507C SNP (5'CAGŌåōCTG-3', PvuII digestion) showed high heterozygosity in both the patients and control groups (Fig. 2). The allele frequencies of T507C were found to have differing distributions in IBD patients and controls. The frequencies of the T (Leu) and C (Pro) allele were 41% and 59% in healthy controls, but 35.5% and 64.5% in CD and 32.1% and 67.9% in UC patients. With respect to allele frequencies of the T507C SNP, patients with UC showed significant differences from controls under logistic regression analysis (P=0.037) (Table 3), while CD patients did not (P=0.194) (Table 4). The genotype frequencies also had different distributions in patients and controls. The TT genotype frequencies were 17.6% in CD, 13.5% in UC, and 15.0% in healthy controls, while CC genotype frequencies were 46.6% in CD, 49.4% in UC, and 33.0% in healthy controls. Patients with CD and UC were more likely to be 507 CC homozygous (P=0.016; aOR, 2.16; 95% CI, 1.16-4.04; P=0.009; aOR, 2.09; 95% CI, 1.19-3.64; respectively) rather than TC heterozygous compared with healthy controls (Tables 3, 4).
DISCUSSION
The present study represents an evaluation of PRCKDBP polymorphisms as potential factors in IBD susceptibility. PRKCDBP is a putative tumor suppressor that is altered in several human malignancies.13,14,15
PRKCDBP is a transcriptional target of TNF-╬▒-NF╬║B signaling, which plays a key role in TNF-╬▒-induced apoptosis,16 and is frequently lost or downregulated in patients with human colorectal cancer.16 TNF-╬▒ is an important pro-inflammatory cytokine involved not only in inflammatory responses, but also apoptosis, cell proliferation, and differentiation.21,22 Thus, it is not surprising that genetic variation in the TNF-╬▒ gene contributes to susceptibility to IBD. Several studies have reported associations between the TNF-╬▒ gene and the development of IBD. SNPs in the promoters of the TNF-╬▒23 and TNFSF17,9,24 genes are involved in genetic predispositions in diverse ethnic groups. Although TNF-╬▒ has been implicated in the pathogenesis of IBD, the role of PRKCDBP has not been recognized in IBD previously. Our previous report is the only to implicate PRKCDBP in IBD.17 In this previous study, we demonstrated that, PRKCDBP expression is tightly controlled by TNF-╬▒ in patients with moderate to severe UC.17 Along with our previous result, considering that PRKCDBP is a proapoptotic tumor suppressor and a transcriptional target of TNF-╬▒, it seems probable that these missense SNPs could generate variant protein products, with varying levels of biological activity. Nevertheless, the association between the SNPs of PRKCDBP and susceptibility to IBD has not yet been determined.
In the present study, four representative intraexonic SNPs (G210A, G237C, T507C, and C797T), which lead to amino acid substitutions, were chosen based on their heterozygosity rates in Asian populations, and we investigated their possible association with susceptibility to IBD. Extremely low heterozygote configurations at three SNP sites (G210A, G237C, and C797T) were seen. The major genotype (GG, GG, and CC, respectively) of these SNPs was found in more than 98% of all groups. Thus, minor variants of these three SNPs in the PRKCDBP gene are very rare in Korean populations. This also indicates that G210A, G237C, and C797T SNPs are not likely associated with susceptibility to IBD, and therefore not useful for the identification of groups at high risk of IBD in Korea. However, this study demonstrated that the genotype frequencies of the T507C SNP of the PRKCDBP gene showed different distributions in IBD patients and healthy controls. The CC genotype frequency was significantly higher in IBD patients than in healthy controls, but TT and CT genotypes were not different between the two groups. Further, the frequencies of the T (Leu) and C (Pro) alleles were 41% and 59% in healthy controls, but UC patients showed a significantly higher frequency of the C allele (67.9%, P=0.037). In CD patients, the frequency of the C allele was also higher than in healthy controls, but this was not statistically significant (64.5%, P=0.194). The finding of a considerable frequency of the C allele in healthy controls demonstrated a weak association between IBD and this SNP of the PRKCDBP gene. Furthermore, it means that PRKCDBP may partially contribute to the pathogenesis of IBD having extensive genetic heterogeneity.
GWASs have identified approximately 163 independent loci for IBD, 92 of which were further confirmed and 71 newly established in the recent International IBD Genetics Consortium "ImmunoChip" study.6 Recent Korean studies have validated GWASs in Caucasian populations, and found novel susceptibility genes for IBD.4,5 Products of these candidate genes mediate various cellular functions, including microbial recognition,25 lymphocyte activation,26 cytokine signaling,20 metabolism,27 and epithelial barrier function.28 Thus, mutations in these genes may be associated with the development of IBD. However, specific functional variations have been demonstrated in only a small number of genes, including NOD2, IL23R, ATG16L1, IRGM, and PTPN22.29,30 Our present study adds a novel candidate gene, PRKCDBP, to the list of genes associated with the development of IBD. The possible mechanism of the association between PRKCDBP and susceptibility to IBD has not been established. Based on our previous study,17 we speculated that PRKCDBP may play a role in the inflammatory processes controlled by TNF-╬▒ in IBD.
Our study has some limitations. First, a functional analysis of PRKCDBP was not performed, and the exact functional consequences of PRKCDBP polymorphisms remain to be elucidated. Second, we did not analyze the clinical characteristics of the patients. Therefore, we could not investigate the relationship between genotypes and phenotypes. Furthermore, we could not exclude the possibility that age imbalances among groups may affect the results because of a lack of clinical data. Third, this was a single-center study conducted in a tertiary teaching hospital in Korea. Therefore, it is not possible to determine whether our results true for other populations. Finally, the number of specimens tested in this study was small. Thus, to confirm the association between PRKCDBP polymorphisms and the development of IBD, a replication of the association study in other populations with a larger number of patients is needed.
Despite these limitations, the results raise the possibility that the T507C SNP of PRKCDBP , a TNF-╬▒-inducible gene with proapoptotic activity, might help to identify patient subgroups at high risk of IBD development. Collectively, these findings suggest that PRKCDBP genetic variants might be associated with susceptibility to IBD development, especially in UC. To our knowledge, this is the first study of PRKCDBP polymorphisms in IBD reported. It is possible that the TNF╬▒/PRKCDBP signaling pathway may play a role in IBD pathogenesis, based on this result and previous reports.1,14,17,18 However, the involvement of PRKCDBP in the pathogenesis of IBD has not been investigated. Thus, further studies at the molecular level and in the clinical setting are needed to explore this possibility in IBD.