


INTRODUCTION
Irritable bowel syndrome (IBS) is a chronic functional gastrointestinal (GI) disorder characterized by abdominal pain associated with irregular bowel movement and stool consistency with the absence of organic causes [1]. Patients with IBS are subdivided into constipation-predominant (IBS-C), diarrheapredominant, and mixed patterns constipation and diarrhea [2]. The worldwide prevalence of IBS ranges between 3% and 22% of the population and approximately one-third of IBS patients suffered from IBS-C [3-6]. In Malaysia, IBS was reported affecting about 15% of the population, with the higher prevalence rate predominantly observed in women [7].
Despite the high prevalence rate, the exact pathogenesis of IBS-C is still uncertain, thus the management approach is mainly targeted on the associated symptoms to improve patient’s quality of life. However, to date, no single drug regimen is effective for the long-term efficacy of the patients’ specific symptoms and there are also significant rates of the associated adverse effects [8]. Therefore, many IBS-C patients opt for an alteration in their diet as a therapeutic strategy. Several studies have proven the beneficial effects of low fermentable oligo-, di-, and mono-saccharides and polyols (FODMAPs), limitation of gasproducing foods, gluten-free diet, dietary fiber supplementation, and/or consumptions of probiotics as a nutrition-based therapy to improve IBS-C patient outcomes [9-14].
Approximately two-thirds of IBS-C patients believe that diet or certain types of foods may trigger or exacerbate their range of digestive symptoms thus, making nutrition therapy the main therapeutic approach in the management of patients [15,16]. Among the IBS-C patients, food rich in carbohydrates, lactose-containing foods, fatty foods, caffeinated drinks, hot spices, and alcohol were affiliated with digestive symptoms such as abdominal pain and bloating [17]. However, the complexity of the food composition, making it harder to identify the specific food items involved in the onset or worsening of the IBS-C symptoms [18]. Therefore, patients tend to excessively practice the dietary restrictions that may lead to a high risk of long-term nutritional inadequacies.
Despite diet and food have been proposed to play a pivotal role in the management of IBS-C [19], relatively few studies been conducted to examine thoroughly the habitual dietary intake among IBS-C patients. Moreover, little is known regarding the dietary adequacy of IBS-C patients before any dietary interventions. Thus, this study aimed to evaluate the dietary intake, macro and micronutrients adequacy among IBS-C against the standard recommended nutrient intake (RNI) and healthy controls.
METHODS
1. Patient’s Selection
A retrospective case-control study was conducted at the gastroenterology outpatient clinics and endoscopic daycare in a tertiary medical center in Kuala Lumpur, Malaysia. Data were collected between April 2018 and April 2019. Adult patients aged 18 years and above with the diagnosis of IBS-C that fulfilled all the recommendations established by Rome IV criteria (diagnostic criteria for functional gastrointestinal disorders) [20] were recruited. To differentiate the IBS-C group from regular constipation patients, the diagnosis was largely based on the history of the symptoms reported by patients. These may include tracking the symptoms of constipation, along with the timing and severity of abdominal pain. IBS-C brings about intense abdominal pain compared to regular constipation. Those subjects without any functional disorder by Rome IV were included as healthy controls. Healthy controls were subjects that were randomly chosen from the staff and employees at the tertiary medical center. All the subjects were screened for eligibility by a gastroenterologist. IBS-C patients and control subjects were excluded if they had any preexisting organic or metabolic disorder (autoimmune disease, any type of malignancies, chronic inflammatory disease, infectious disease, malabsorption syndrome, and diabetes mellitus). Those who consumed antibiotics, probiotics, and/or laxatives less than 6 weeks before the recruitment were excluded. Those who were pregnant and lactating were also excluded. Those who met the criteria were given an information sheet and written informed consent was obtained from all the subjects on enrolment. The Universiti Kebangsaan Malaysia Medical and Research Ethics Committee (UKMREC; approval No. FF-2017-214) granted ethical approval of this study.
2. Dietary Intake Assessment
Dietary intake of all the IBS-C patients and healthy control subjects was assessed retrospectively using a validated food frequency questionnaire (FFQ) [21] which was adapted from the Malaysian Adult Nutrition Survey FFQ. This dietary assessment method was developed to evaluate the long-term habitual dietary intake of the subjects over the past year. The FFQ was formatted and included the detailed instructions and guidelines for the interviewer so that the information on the usual intake could be obtained using non-leading and open-ended questions. The 126-food items listed in the FFQ were categorized into 15 food groups, namely: cereal and cereal products, cooked rice and noodles, traditional kueh, desserts and confectionery, meat and poultry, internal organs, fish and shellfish, legumes, vegetables, fruits, milk and dairy products, jam and spread, beverages, sauces and condiments, and fast-foods. Malaysian meals were different compared to Western meals. Malaysian meal items listed in this FFQ reflect the multi-ethnic society of Malaysia sharing diverse food cultures. In general, most Malaysian meals are either based on rice or noodle dishes that are commonly consumed as the daily source of carbohydrate [22], accompanied with a variety of side dishes or lauk that consist of protein-based foods such as meat, egg, fish, and/or seafood dishes as well as vegetable dishes [23]. Meanwhile, when considering the Western meals in general, red meat is the most consumed food item, e.g., steaks or cutlets are the most preferred dishes across the West. Besides, the portion size of Western meals tends to be bigger compared to Malaysian meals.
The FFQ was administered through a one-to-one interview where subjects were requested to provide the type of normally consumed food items, the frequency of intake, the portion size, and the number of serving sizes consumed each time either per day, per week, per month, per year or never, guided by a dietitian. The subject was required to answer only one option. To minimize errors while assessing the dietary intake of subjects, the interview process was started by asking the subject to recall all of the food items that were usually consumed daily and the recall process was built up during a period of weeks and months. The household measurements that were available in the Atlas of Food Exchanges and Portion Sizes [24], such as a cup, matchbox size, small bowl, and spoons, were used to help better quantify the portion size. This FFQ also included questions on preparation methods for the related food items listed. Completed FFQs were then re-checked by a dietitian for completeness and accuracy.
The frequencies of the food intake in the FFQ had then been translated into the amount of food intake using the devised formula by Wessex Institute of Public Health University of Southampton, 1995; according to the following equation [25].
Weight of the food (g) per day = frequency of food intake (conversion factor) × serving size × number of serving × weight of food in one serving (g)
The 4th edition of Nutrition Composition of Malaysian Foods [26] was also used as a reference for accurate analysis of the data. From the amount of food taken per day, the detailed nutrient intake analysis was calculated using the Nutritionist ProTM Diet Analysis (Axxya Systems, Woodinville, WA, USA) software. The calculated data of nutrients intake were analyzed against the RNI for Malaysian (RNI 2017) and were then compared with the healthy controls.
3. Statistical Methods
Data were compiled and analyzed using IBM Products and Service Solution (SPSS) Statistics version 23 (IBM Corp., Armonk, NY, USA). The distribution of all the variables was checked for normal and non-normally distributed variables using skewness and kurtosis and was later verified by using Kolmogorov-Smirnov test. No missing data was found in this study. All the normally distributed data were described as mean ± standard deviation (SD). Descriptive analyses were used to describe the frequencies and proportion (%) of all the quantitative data. Comparison of the continuous variables between IBS-C patients and healthy controls were analyzed using independent sample t-test. Chi-square test was performed for comparison of all the categorical variables. The significance level was set at P-value < 0.05.
RESULTS
1. Baseline Characteristics of IBS-C Patients and Healthy Control Subjects
A total of 306 subjects were participated in the study and completed the FFQ, among which 218 (71.2%) were diagnosed with IBS-C and 88 (28.8%) of the remaining subjects were included as the healthy controls. The enrolled numbers of IBS-C and controls were statistically appropriate. The detailed baseline characteristics of the study subjects were summarized in Table 1. The mean age for IBS-C patients and healthy control subjects were 31.32 years and 29.27 years, respectively. IBS-C patients and healthy subjects were comparable in age, gender, ethnicity, educational level, monthly income, and marital status (P>0.05).
2. Comparison of Daily Intake of Food Groups between
IBS-C Patients and Healthy Controls The comparison of the mean amount of food consumption between IBS-C patients and healthy controls were shown in Table 2. Compared with healthy subjects, patients with IBS-C had significantly lower consumption of wholegrain products (21.9 g/day vs. 40.1 g/day, P<0.001), fried or fatty foods (215.1 g/day vs. 270.3 g/day, P=0.004), dairy products (150.9 g/day vs. 231.9 g/day, P<0.001), fruits (57.0 g/day vs. 72.5 g/day, P<0.001) and vegetables (60.1 g/day vs. 91.8 g/day, P=0.021).
3. Comparison of Dietary Intake between IBS-C Patients and Healthy Control Subjects against the RNI for Malaysian (RNI 2017)
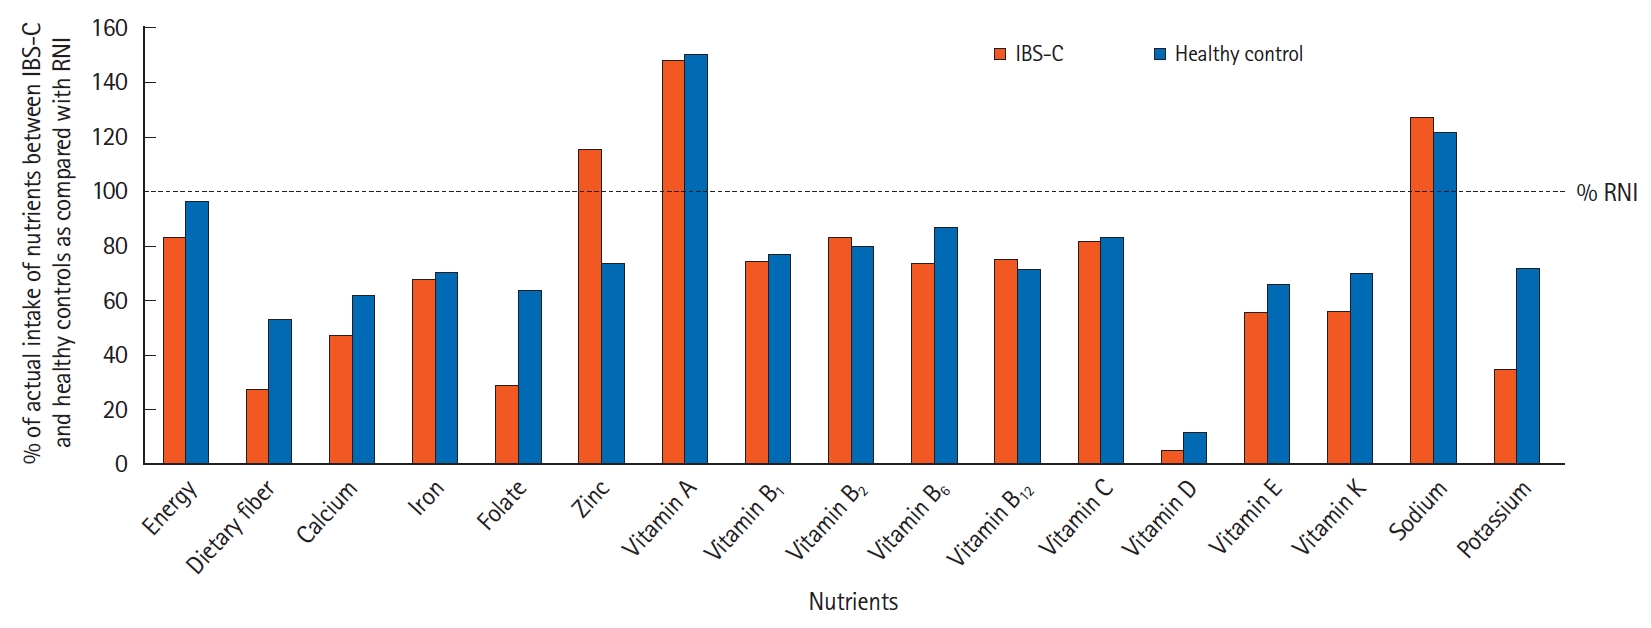
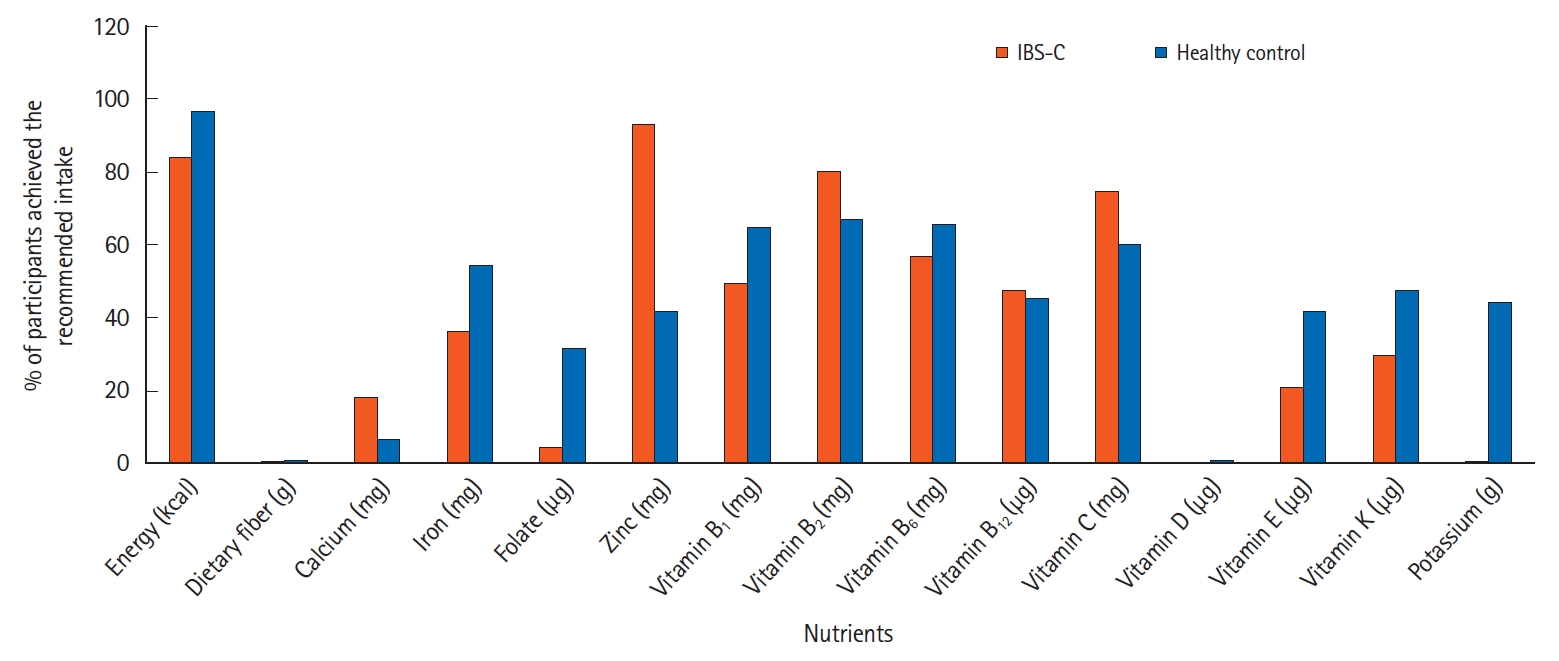
The mean (± SD) daily intake of energy, macronutrients, and selected micronutrients for the IBS-C patients and healthy control groups were presented in Table 3. The energy intake of IBS-C patients was significantly lower (1,631 ± 174 kcal) compared to healthy control subjects (1,959 ± 209 kcal) (P<0.001). As shown in Fig. 1, the actual intake of energy was 83.3% among the IBS-C patients and 96.5% in the healthy control subjects as compared with the Malaysian RNI. About 84% of IBS-C patients had achieved the recommendation for energy, whereas 97% of healthy control subjects achieved the standard energy requirement as shown in Fig. 2.
Among IBS-C patients, the intake of protein (71.4 ± 9.7 g) and fat (57.8 ± 5.1 g) was significantly lower than the intake of protein (81.4 ± 9.2 g) and fat (67.2 ± 8.0 g) of healthy subjects (P<0.001). However, when expressed as the percentage from total energy intake, these intakes did not differ significantly between the 2 groups. The total intakes of protein and fat were lower in both groups than recommendations, while the proportion of protein and fat were similar between the 2 groups. Daily total dietary fiber intake among the IBS-C patients (5.5 ± 1.6 g) was significantly lower than the intake of dietary fiber of healthy control subjects (10.7 ± 1.2 g) (P<0.001). However, both groups did not meet the RNI of 20-30 g/day. Less than 5% of the IBS-C patients and healthy subjects achieved the standard recommendation for dietary fiber.
Compared with healthy subjects, IBS-C patients had significantly lower daily intake of folate (116.6 ± 38.0 µg vs. 255.0 ± 84.0 µg, P<0.001), potassium (1.7 ± 0.3 mg vs. 3.4 ± 0.6 mg, P<0.001), vitamin B6 (1.0 ± 0.2 mg vs. 1.1 ± 0.2 mg, P=0.032), vitamin D (0.8 ± 0.7 µg vs. 1.8 ± 1.2 µg, P<0.001), vitamin E (4.6 ± 1.6 µg vs. 5.7 ± 1.2 µg, P<0.001), and vitamin K (32.4 ± 23.2 µg vs. 41.5 ± 21.0 µg, P<0.001). However, the intake of zinc in IBS-C patients was significantly higher than in healthy subjects, (5.9 ± 1.8 mg vs. 3.8 ± 1.0 mg, P<0.001). As compared with RNI 2017, the intake of vitamins B1, B2, B6, folate, B12, E, K, and potassium in both groups did not meet the RNI for Malaysians. However, vitamin A and sodium intake among the IBS-C patients and healthy control subjects exceeded the RNI of 600 µg and 1,500 mg respectively.
DISCUSSION
In this study, both groups of IBS-C patients and healthy controls had reported eating a diet with macronutrients and micronutrients composition that did not meet the RNI for the Malaysian population. Also, the findings of the current study found that patients who were affected by IBS-C resulted in having poorer energy and nutrient intake as compared to healthy control subjects, possibly due to alteration or restriction of certain food items from their daily diet that might contribute to the nutritional deficiencies among these patients. Several studies have reported that IBS-C patients avoid different food items that strongly linked with their GI symptoms such as frequent episodes of gases and bloating, abdominal pain, and a feeling of incomplete evacuation [16,27]. However, poor understanding of dietary factors that exacerbate these symptoms possibly leads to the reduced intake of essential nutrients among IBS-C patients.
In this current study, we do not have the information on whether the patients have altered or restricted their diet due to symptoms or other reasons. However, as food and diet have appeared to be the pivotal roles in the generation of symptoms in most of the IBS-C patients [18], we hypothesized that patients with IBS-C often restrict some of the food groups as a way of coping with their disease. Moreover, it has been reported that almost 90% of patients willingly constrict their dietary intake with the aim to manage their symptoms [1,17]. As we compared this with a healthy population, some studies have reported that patients with IBS elicited their GI symptoms by one or more provocative dietary agents, such as carbohydrates, fatty foods, milk-based products, cruciferous vegetables, spicy foods, and coffee [15,16].
Therefore, this can deflect IBS-C patients to be more selective of their daily food choices. Many IBS patients restricted these provocative dietary components and some of them resulted in better GI symptoms, however, this potentially leads the patients to nutritional deficiencies or poorer quality diets [28]. While this current study has found nutritional inadequacies among IBS-C patients, a study among 104 IBS patients in the United Kingdom had shown contradicting results in which, the intake of energy and micronutrients (calcium, folate, vitamin B1, and vitamin C) had significantly exceeded the reference nutrient intakes [29]. This is consistent with a previous study among 187 IBS patients in Sweden that demonstrated a significantly higher daily intake of vitamin E, folate, iron, and vitamin C [30]. Although certain food items exacerbate the IBS-C symptoms and the practice of exclusion diet is common, patients manage to manipulate their diet with nutrient-rich foods and not result in inadequate dietary intake.
Malaysian patients with IBS-C in this study demonstrated poor intake of dietary fiber as compared with the recommendation, which is a growing concern regarding the intake of vegetables, fruits, and wholegrain products which may also influence the daily intake of vitamins and minerals. Indeed, in this study, the IBS-C patients had a lower intake of vitamins B1, B2, B6, folate, B12, E, K, and potassium, which is in accordance with other studies [31,32]. In some IBS-C patients, intake of high dietary fiber may exacerbate the symptoms and can frequently cause abdominal pain, bloating, and distension [33,34]. The incomplete digested carbohydrate such as in vegetables (e.g., onions, asparagus, broccoli, cabbage, peas, and cauliflower) and fruits (e.g., prunes, plums, apple, and mango) may increase the intestinal luminal water content through the osmotic activity, which results in rapid gas production (e.g., hydrogen, methane, and carbon dioxide) and subsequent abdominal distention due to their fermentation by gut microbiota [35,36]. Besides, a higher dietary fiber consumption also provides benefits to IBS-C patients through an increase in the fecal bulk and quickening of the colonic transit time, which results in decreased water reabsorption and increases the stool weight [34,37]. Thus, the high fiber diet could act as a triggering factor for the GI symptoms or can be therapeutically useful in IBS-C management.
In recent decades, scientific evidence has emphasized the roles of dietary choices among IBS patients and diet manipulations as the potential treatment strategy. The British Dietetics Association (BDA, 2016) has provided the dietary algorithm for the clinical practices in the management of IBS, which emphasized what should be advised to these patients [14]. In this guideline, the first line of a dietary approach focusing on healthy eating and lifestyle which includes reducing the intake of alcohol, caffeine, spicy food, and fatty food, restriction of lactose-based products, and dietary fiber modification that can be offered by any healthcare professional [14].
The second line of dietary advice comprises the implementation of a diet with low FODMAP under the guidance of a dietitian [14]. Although there has been increasing evidence that intervention with low FODMAP diet ameliorates IBS symptoms, the efficacy, acceptance, and complexity of a low FODMAP diet among the Asian population remains uncertain especially in patients with IBS-C [38]. Generally, the usual food ingredients found in most of the Asian diet may include onion, garlic, shallots, legumes, and wheat-based products [38]. Due to distinct cultural and dietary habits of different major ethnic groups among the Malaysian population (e.g., Malay, Chinese, Indian, and indigenous groups), this has made it very difficult to specify and quantify the food items that exacerbate to symptoms of IBS [38].
In this study, IBS-C patients might follow these recommendations to decrease the symptoms by restricting some of the above-mentioned food items. For instance, in our study, IBS-C patients had reduced the number of certain food groups such as fried foods, thereby leading to a reduced intake of total energy and fat than healthy controls. Some studies have shown that duodenal lipids have increased the perception of rectal distension, which provides evidence of the restriction of fat intake in IBS-C patients [39,40]. However, most of the IBS-C patients often go to the extreme measure following dietary advice from these recommendations, and this leads to nutritionally deficient diets. In this study, a decreased fat intake may implicate the decrease in some of fat-soluble vitamins (e.g., vitamin D, E, and K). Also, the dietary advice of restriction of lactose-based products such as milk and dairy products in IBS-C may imply a decreased intake of calcium, potassium, vitamin B1, B2, B6, B12, D, E, and K which were consistent with some previous studies [16,29,30,41].
The results of this current study illustrated the need for a skilled dietitian who is knowledgeable in the dietary management of IBS, as clinicians may lack sufficient training in dietary skills and knowledge of food composition. Individualized dietary guidance is necessary to identify a suitable diet to which the patient is likely to adhere for a long-term [42]. However before embarking on the new diet plans, dietitians should explore the patient’s interest in making the dietary changes, take a dietary history, and assess the unusual food choices or dietary behavior as well as explore the patient’s ability to adopt a restricted diet [43]. A food diary kept by IBS patients can be a particularly helpful way to establish the potential “trigger foods” that exacerbate the symptoms. Dietitians, while working with patients suffering from IBS, should review the food diary and discuss the specific amounts of foods that are consumed and their relation to the patient’s overall symptoms [44]. This approach minimizes the unnecessary food restriction behavior which may be the cause of nutritional deficiencies and ensures that a maximum variety in the diet is achieved while significantly improving the symptoms [45]. As implementation and education of a specific restriction diet can be very challenging, dietitians need to educate the patients regarding the principle of diet together with suitable food alternatives to ensure the nutritional adequacy of an individual. Also, the role of a dietitian is important not only during the initial stages of establishing the dietary modification but is also integral in the subsequent step of gradual re-introduction to specific food components while evaluating their tolerance in the generation of symptoms, considering the specific food preferences and usual dietary habits [46].
Although seeing the dietitian repeatedly is likely crucial for the consistent success of the diet plan in IBS, but it would not always be achievable in the clinical settings, as it requires a highly motivated patient and this can be rather time-consuming. The adherence to the new diet plans also requires strenuous effort, therefore making it tiring and difficult for many IBS patients. A survey conducted in the United States has revealed that only a minority (21.0%) of gastroenterologists actually refer IBS patients to dietitians for nutritional counselling instead, they used the educational handouts to provide nutritional advice to their patients [47]. This is actually against the proper guidance to implement the complex dietary interventions especially for long-term success [48].
There are inherent limitations of using FFQ as a method of dietary assessment that should be acknowledged when interpreting the results. As this is a retrospective method where subjects were enquired to estimate their dietary intake for the previous year, therefore they may prone to recall bias. This questionnaire also solely relied on self-report, thus the food intake may be underreported or over-reported. In this study, we described a step-by-step guide to facilitate and improve the quality and accuracy of the dietary information collected. Throughout the guide, we made an effort to obtain accurate data and overcome the recall bias according to the study objective and subject’s characteristics. Dietary assessments such as food records or food diaries should be considered, as this prospective dietary method does not require the recall of foods and was much more accurate in assuming the amount of food consumed. In this present study, as we do not have the information regarding the reasons for dietary restriction/alteration, thus a detailed analysis of dietary intake is needed to further identify whether specific food items that are believed to aggravate the symptoms are avoided. A prospective study is needed to evaluate the relationship between the symptom’s severity and the changes in the nutritional consumption among IBS-C patients. This might influence the effectiveness of dietary manipulation as one of the therapeutic approaches in IBS-C management. In this study, the socioeconomic status of healthy controls tended to be better, compared with the IBS-C group especially regarding the monthly income of the control group, which tended to be higher (P=0.061). Therefore, it might explain why healthy controls were likely to select healthier food choices compared to IBS-C patients. In addition, the number of healthy controls was relatively small (28.8%) compared to IBS-C patients. It might be preferable to select more healthy subjects matched for socioeconomic status to further address the differences regarding their dietary intake. In this study, the healthy controls were selected as staff working in the tertiary medical center, leading to the potential of high selection bias to occur. It would be advantageous to select the control group among a general population to minimize the selection bias. Our study only covers patients with IBS-C, as the aim of this current study was solely to investigate the nutritional adequacy among IBS-C patients. Besides, we do not have the detailed information regarding the other subtypes of IBS including the data on the number (%) of patients attended the medical center. Because of this, we did not include the comparative dietary pattern analysis according to the subtypes of IBS. In this study, we also do not have detailed assessment of anthropometric measures (e.g., weight, body mass index, and waist circumference) although these factors were likely to have an impact on the dietary pattern of the enrolled subjects. Furthermore, we did not investigate whether there were subjects with other comorbidities (e.g., hypertension, diabetes mellitus, and cardiovascular disease), although it has been reported that IBS-C patients with comorbidities may have an impact on the clinical course of the disease. Our study also does not have the data regarding the frequency of alcohol drinking and smoking although it would be advantageous to analyze the differences of these factors between the 2 groups.
In conclusion, the findings of this study revealed that IBS-C patients consumed a diet that was deficient in macro- and micronutrients when compared against the standard RNI and healthy controls. Therefore, these dietary evaluations are needed to provide information for dietitians prior to devising planning strategies for dietary intervention targeting IBS-C patients. To succeed with dietary intervention, ongoing nutrition counselling should be provided by dietitians and a suitable diet should be recommended and adapted for every individual’s circumstances, as well as monitoring the progress and compliance of patients.