


INTRODUCTION
Changing of lifestyle increases the prevalence of multifactorial and chronic diseases, such as inflammatory bowel disease (IBD), in different manners [1]. IBD is characterized by idiopathic inflammation of the gastrointestinal (GI) tract and has 2 main types, ulcerative colitis (UC) and Crohn's disease (CD) [2,3]. UC is a costly disease and imposes a heavy direct and indirect burden on populations [4-6]. Therefore, researchers have been investigating different facets of it like its pathogenesis, diagnosis, and treatments. UC is a multifactorial disease that is thought to result from the functional dysregulation of the GI immune response caused by a complicated combination of genetic, microbial, and environmental factors [7].
Regarding the pivotal role of autophagy in homeostasis [8-10], autophagy malfunctions have been linked to the pathogenesis of a wide variety of diseases, including IBD. Also, identifying disease-susceptibility genes and discovering the autophagy genes ATG16L1 [11,12], IRGM, and NOD2 as risk factors for CD turned the spotlight on autophagy in research on IBD [13]. Atg5 is one of the most important proteins required for autophagosome formation, which plays a vital role by making a complex with Atg12 and Atg16 [14,15]. On the other hand, there is an emerging role for microRNAs (miRs) in the regulation of autophagy [16]. Different studies have unveiled the regulatory impact of miR-30a, miR-181a, and miR-374a on the expression of Atg5 mRNA [17,18].
Considering the importance of autophagy in the pathogenesis of IBD, tracking the changes of Atg proteins in these patients might provide us with valuable information and develop our knowledge for taking further diagnostic and therapeutic steps. Therefore, in the present study, we aimed to evaluate and compare Atg5 levels in serum, intestinal tissue, and stool samples collected from healthy controls (HCs) and UC patients. Moreover, we assessed the miR-181a level as either a regulator for the Atg5 expression or a promising biomarker for UC diagnosis.
METHODS
1. Study Setting and Ethical Consideration
The Human Ethics Committee of Shiraz University of Medical Science, Shiraz, Iran approved the protocol of this study (IRB No. IR.SUMS.REC.1395.S1217), which was performed from December 2016 to February 2018 at Namazi and Faghihi Hospitals. Totally, 30 healthy participants, referring for an annual checkup (with no inflammation, intestinal disorders or IBD symptoms), were selected and included in the HC group. Also, 15 individuals diagnosed with active UC formed the patient group. Participants’ information and history were obtained by asking them directly and referring to their medical records and their informed consent was waived (Table 1). Patients with infectious colitis, colorectal cancer, and history of consuming some medications, including nonsteroidal anti-inflammatory drugs and colon polyp, were excluded from the study. The 2 groups were age- and sex-matched. The diagnosis of UC was confirmed by standard parameters. To collect inflamed mucosal samples, pinch biopsies were withdrawn from the colonic regions, which showed clear symptoms of UC such as the loss of vascular pattern, erythema, and spontaneous bleeding or ulceration.
2. Sample Preparations
Serum, colonic pinch biopsies, and stool were obtained from both groups. One part of the freshly obtained colon biopsies was stored in liquid nitrogen until further use. For preparing tissue homogenate, tissue samples underwent several freezethaw cycles, followed by mechanical homogenization and exposure to ultrasonic waves (probe: 0.1 mm, 100 W, 30 kHz; UP100H, Hielscher Ultrasonics, Teltow, Germany). Prepared tissue homogenates were stored in -80°C for further assessment by enzyme-linked immunosorbent assay (ELISA). The other part of the tissues was immersed in 10% formalin to be used for immunohistochemistry staining.
Stool sampling was done during the clinical examination of patients and healthy participants. One milliliter of phosphatebuffered saline buffer was added to 100 mg stool samples, followed by vortexing for 15-20 minutes at 4°C (or until all the material was suspended). After that, the solids were separated by centrifugation for 10 minutes, 5,000 g at 4°C, and the extract was stored at -80°C until further assay.
Approximately, 5 mL of blood was collected in 2 parts. The first 2.5 mL was utilized for serum isolation, and the remaining was transferred into the tubes, containing heparin as an anticoagulant, to be subsequently used for miR extraction. Serum was isolated after centrifugation (1,000 g for 20 minutes) and stored at -20 C for Atg5 level measurement by ELISA.
3. Atg5 ELISA
Atg5 concentration in serum, stool, and tissue homogenates was measured by sandwich ELISA using a Human ATG5 ELISA Kit (EIAab Science Co., Ltd., Wuhan, China). Optical density was determined using an ELISA reader (Convergys, Berlin, Germany) set to 450 nm. Atg5 concentrations were calculated using the standard curve.
4. Quantitative Real-Time PCR
Blood total RNA was extracted using Denazist Total RNA Isolation Kit (Denazist, Tehran, Iran) according to the manufacturer’s instruction. Briefly, plasma was isolated from whole blood through centrifugation at 1,000 g for 15 minutes. One milliliter of G1 buffer was added to 200 µL plasma followed by vortexing for 1 minute two times. After 5 minutes incubation at room temperature the supernatant was isolated recruiting centrifugation at 16,000 g for 5 minutes. Then 200 µL of chloroform was added to the isolated supernatant and after 3 minutes incubation at room temperature following by centrifugation at 16,000 g for 15 minutes, the top phase was transferred to the new tubes. Isopropanol and G2 buffer were added afterward and the same cycle of incubation and centrifugation was applied. The supernatant was decanted and 1 mL of 70% ethanol was added to the pellet, centrifuged at 16,000 g for 5 minutes at 4°C, air dried and dissolved in DNase/RNase-free distilled water and stored at -80°C. Poly A tail was added to 3’ end of miRs prior to the cDNA synthesis, and cDNA was produced employing Pars Genome cDNA Synthesis Kit (Tehran, Iran) and Veriti 96 well Thermal Cycler (Thermo Fisher Scientific, Waltham, MA, USA). SYBR Green-based quantitative real-time polymerase chain reaction (qRT-PCR) was used to confirm the expression changes of miR-181a in target groups with Applied Biosystems StepOne Real-Time PCR System (Foster City, CA, USA). A thermocycler profile, including 95°C for 10 minutes, followed by 40 cycles of 63.5°C for 2 seconds, and 72°C for 1.3 seconds, was applied for miR-181a amplification. U6 small RNA was recruited as an internal control and 2 replications were performed for each sample. Forward and reverse primers of miR-181a were purchased from Pars Genome (reference No. of Pg-4487-03; Tehran, Iran). The expression of miR-181a was compared in controls and patients utilizing 2-∆∆Ct method and independent t-test by considering a P<0.05 as significant.
5. Immunohistochemistry
The distribution of Atg5 in the colonic tissue of studied subjects was evaluated using the immunohistochemistry staining. In brief, the tissues were fixed in 10% buffered formalin, embedded in paraffin, and cut into 3 μm-thick slices. After processing, the slides underwent staining procedure using Diagnostic BioSystems kit (Pleasanton, CA, USA). For this purpose, slides were incubated in Peroxidase Blocks for 5 minutes and then washed with Immuno Wash Buffer. After blocking and incubation with the dilution 1:50 of primary antibody (antiATG5 antibody; anti-ATG5 autophagy related 5 homolog [full length]) (Diagnostic BioSystems, Fremont, CA, USA) for 45 minutes, the slides were incubated with UnoVue HRP polymer reagents (Diagnostic BioSystems). The Stable DAB/Plus substrate working solution was papered and the slides were incubated with this solution, followed by incubation with counterstain (hematoxylin). Finally, the tissues were dehydrated using a graded ethanol series. Coverslips were applied and the slides were analyzed with a light microscope. The percent of cells positive for Atg5 staining was determined using QuPath software (Queen’s University, Kingston, ON, Canada).
6. Statistical Analysis
Quantitative and qualitative data were expressed as mean ± standard deviation and frequency (percentage). Data were analyzed by independent t-test and Mann-Whitney test (for expression rates of miR-181a in UC and HCs) using SPSS version 21.0 (IBM Corp., Armonk, NY, USA). P<0.05 was considered as significant.
RESULTS
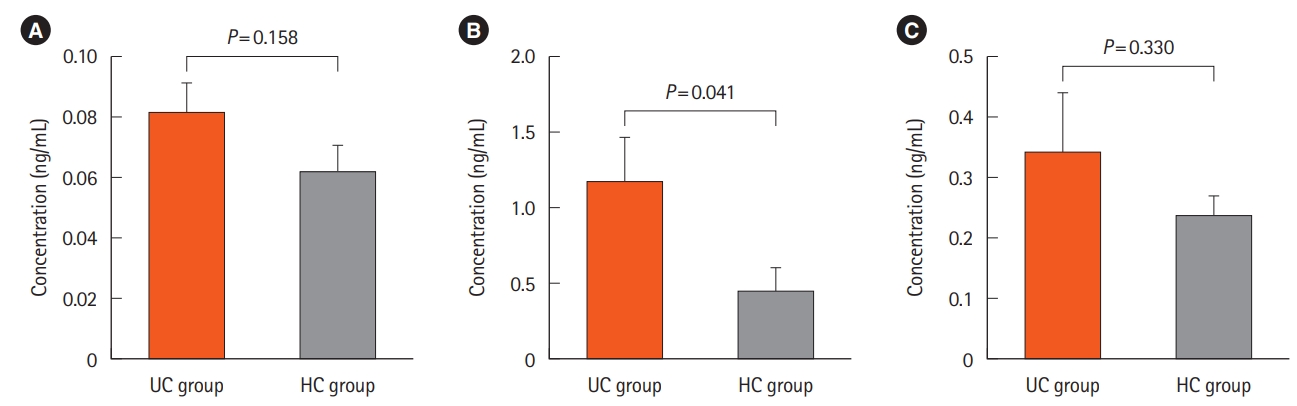
Fecal Atg5 level was significantly higher in UC patients. According to the results provided by ELISA, Atg5 concentration was significantly higher in the stool samples of UC patients as compared to that of the HCs (P<0.05). Although theAtg5 level was also higher in the colonic tissues of the UC group compared with that of the HC group, this difference was not statistically significant (P>0.05). Furthermore, no significant difference was detected in the serum concentration of Atg5 between the UC and HC groups (P>0.05) (Fig. 1).
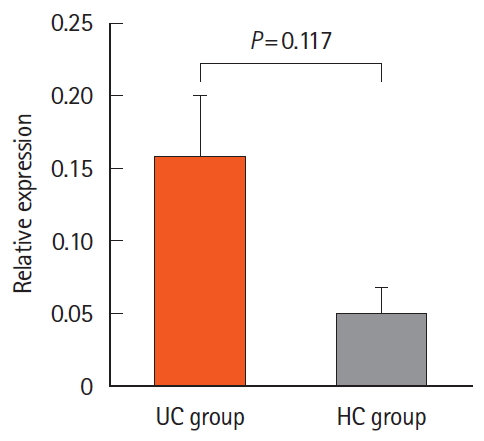
There were no significant changes between the UC patients and the HCs in terms of the expression of miR-181a. Expression level of miR-181a in blood samples of our studied groups was determined using qRT-PCR. The data were normalized by U6 as internal control, and expression levels were calculated using fold change for the 2 groups mentioned above. The expression of miR-181a was higher in the UC group compared to that of the HC group, but the changes were not significant (P>0.05) (Fig. 2).
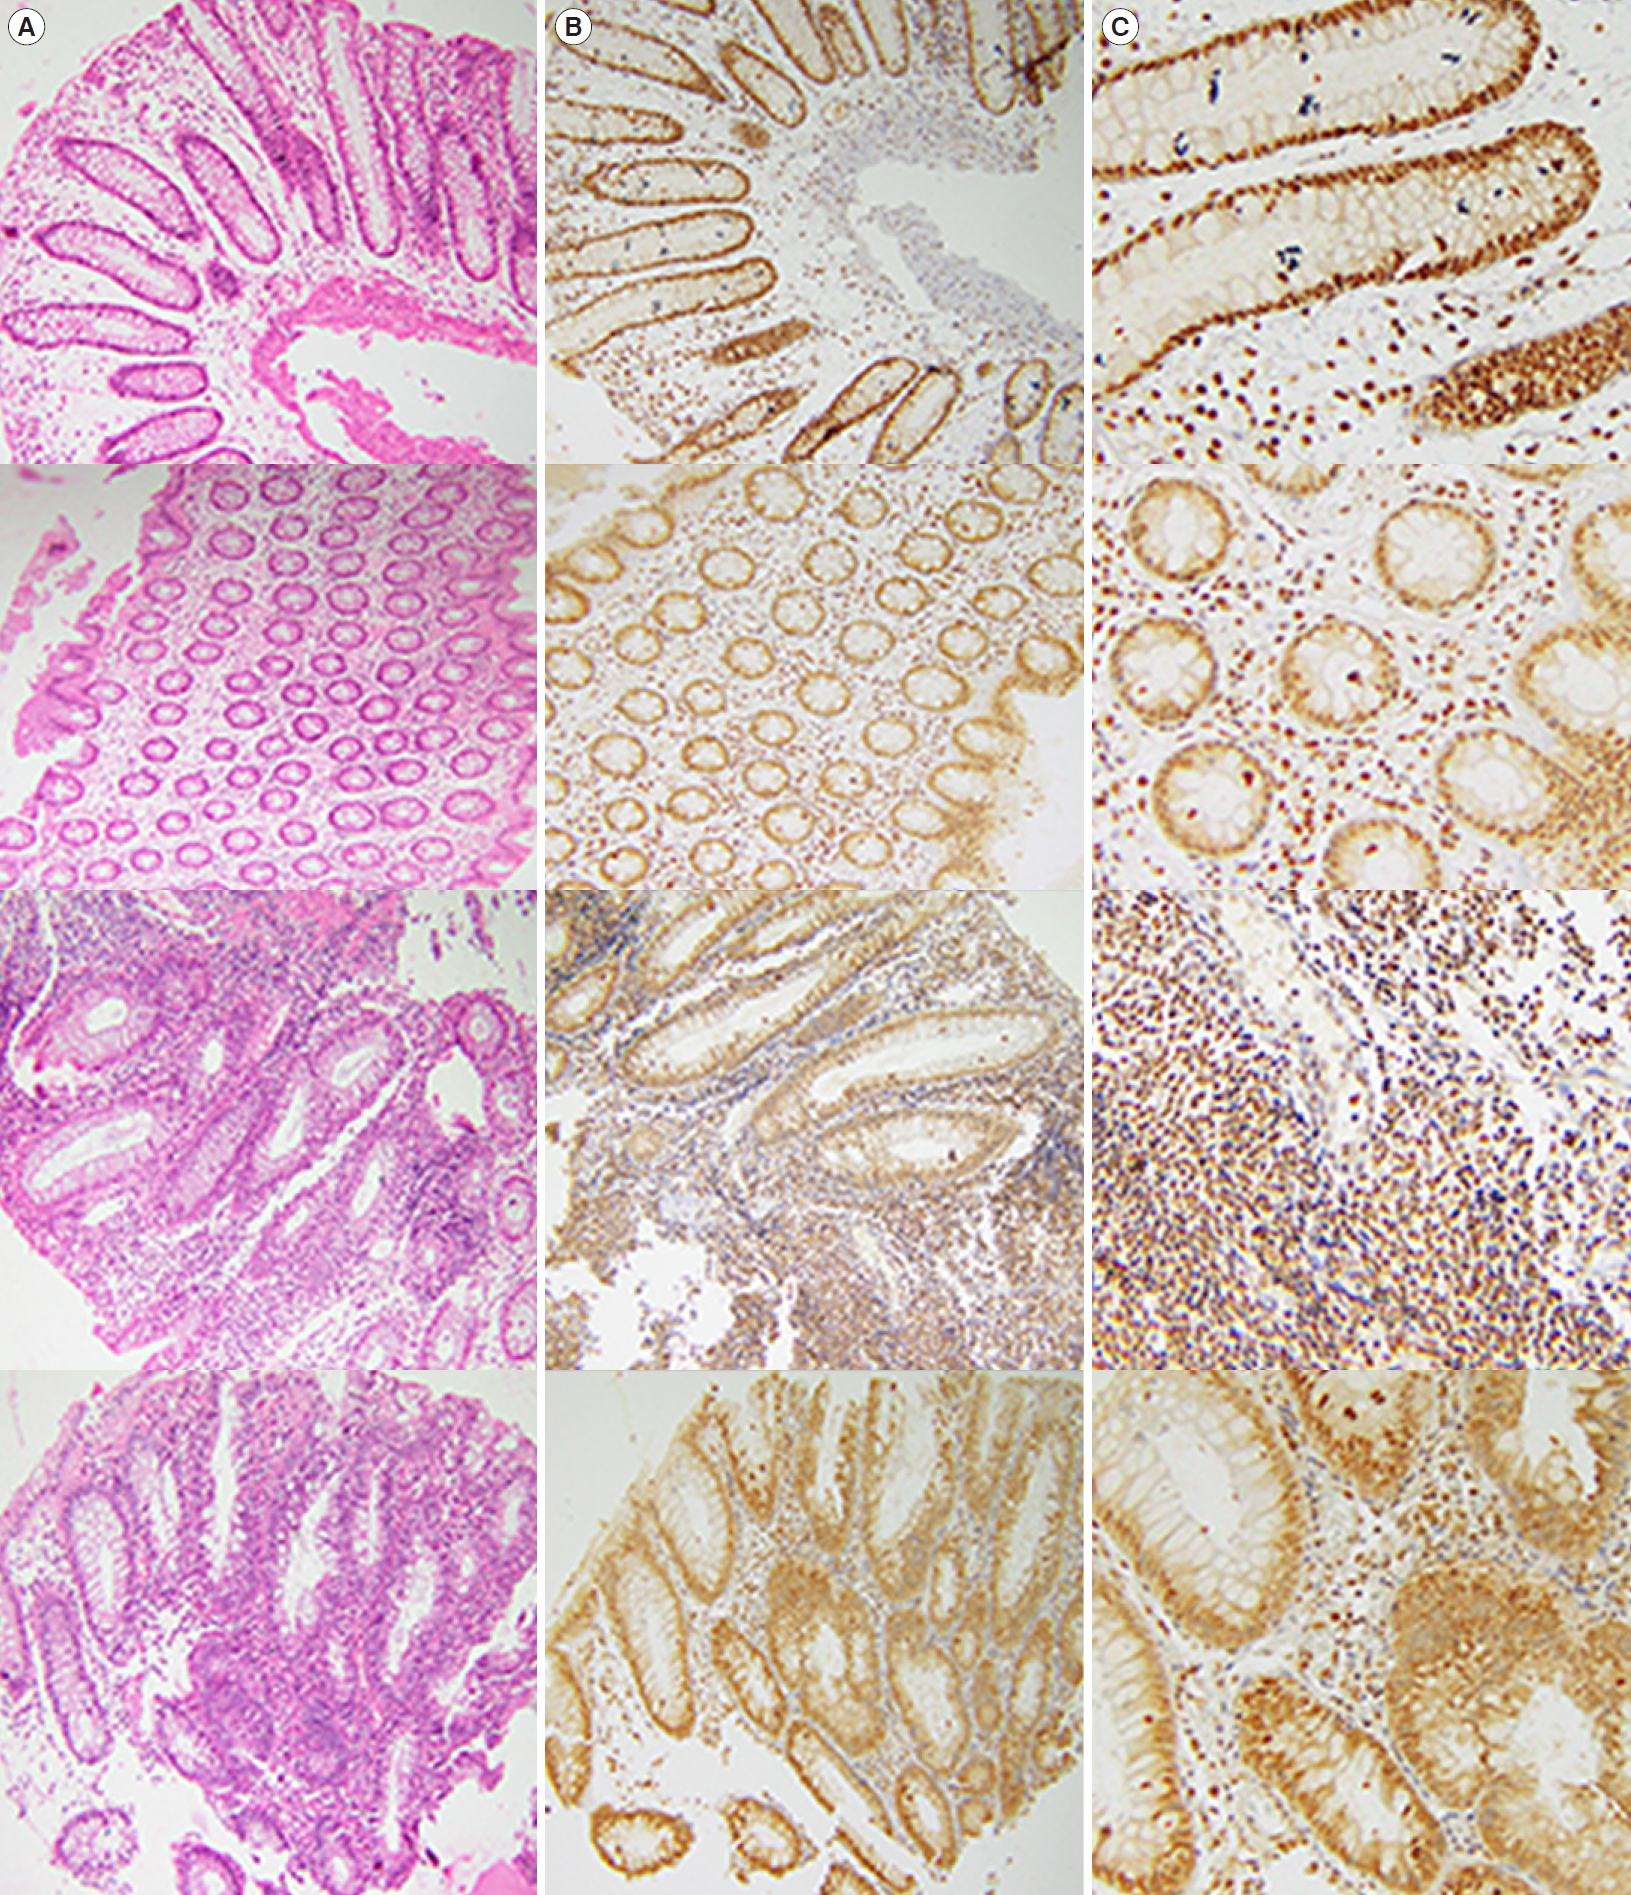
Atg5 showed a clear distribution in the colonic tissue samples. Immunohistochemical reactivity for ATG5 was detected either in the inflamed mucosal tissues of the UC patients or those of the HCs (Figs 3, 4). In addition, the results of immunohistochemical staining and ELISA measurement of Atg5 in tissue showed similar patterns, in such a way that regardless of its higher amounts in patients, there was no significant difference between the studied groups.
DISCUSSION
In the present study, we evaluated the role of Atg5 and miR-181a in the pathophysiology of UC. We found no significant difference in the expression of miR-181a in the blood samples of UC and HCs. Also based on the immunohistochemistry, we found high positivity without any significant difference between the 2 groups in the quantitative analysis.
The amounts of main autophagy-related proteins differed in UC patients compared to those of the non-UC individuals. For instance, the serum levels of Atg7 have been reported to be lower in UC patients compared to those of HCs [19]. In another attempt to determine the amounts of Beclin1 in UC, it was reported that Beclin1 concentration was significantly higher in the colonic tissues of the UC patients [20]. However, a very recent study conducted by Paiva et al. [21] revealed that the level of Beclin1 in the colonic tissues of patients suffering from UC was lower than that of the HCs. In addition, LC3II, another vital protein in the autophagy signaling pathway, and p62 displayed higher concentrations in the UC patients participating in their study. Moreover, Zhao et al. [22] assessed the expression of Beclin1 and LC3B in the colonic tissue of mouse, subjected to IBD induction by trinitrobenzene sulfonic acid, using Western blot. The results of their study indicated that the expression of Becline1 and LC3B was significantly higher in IBD patients than in the HCs.
On the other hand, several recent studies have highlighted the importance of Paneth cell autophagy in the pathogenesis of IBD [23,24]. Cadwell et al. [25] also showed that Atg5 and Atg16L were essential for the Paneth cells to function properly to the extent that ATG16L1- and ATG5-deficient Paneth cells were found to have remarkable abnormalities in the granule exocytosis pathway. To the best of our knowledge, there was no data at the time of doing the present research about the changes of the autophagy-related proteins in the feces of UC patients. In this study, a significant difference was observed between UC group and HCs in terms of the amounts of Atg5 in their stool samples, leaving us with the conclusion that maybe autophagy pathway and its related molecules might provide us with a promising biomarker for diagnostic goals, however, because of the small size of our studied population further studies are needed. Given the importance of Atg5 companions, Atg16L1 and Atg12, for its proper function, evaluating the levels of Atg5 in this complexes seem to be crucial for more convincing deductions in further investigations. However, considering the few numbers of studies done in this area and given the paradoxical nature of the results obtained, more studies need to be done in the future so that more reliable information will be accessible.
miRs, encompassing 19-25 ribonucleotides, regulate gene expression by interacting with 3´ untranslated region (3’-UTR) elements of their target mRNA and interfering with their expression [26-28]. In a study conducted by Tekirdag et al. [26], miR-181a overexpression caused a reduction in the Atg5 cellular levels. They concluded that miR-181a could play an important role in the regulation of Atg5 and autophagy. Since miR-181a has been demonstrated to have a regulatory effect on Atg5 through 3′-UTR-based reporter assays [16,26], we evaluated its expression in the blood samples by qRT-PCR. We found no significant differences between the UC patients and HCs in terms of the expression of miR-181a.
Significantly different expressions of 11 miRs in patients with active UC versus HCs documented by Wu et al. [29] was the first indication of the emerging role of miRs in UC. Various studies have thus far confirmed the role of miRNAs, mostly through their effects on the immune system and inflammatory pathways, in the onset and development of IBD [30]. Given the role of autophagy in the pathogenesis of IBD, several studies have focused on the elucidation of the interaction between miRs and autophagy in IBD specific mechanisms [16,31,32]. For instance, a recent study on the mucosal samples of children with IBD reported that the expression of NOD2, an IBD-relevant autophagy gene, was negatively controlled by miR-320 [33]. ATG16L1 is one of the key adapter proteins that play a role in the formation of autophagosome by forming a complex with Atg5 and Atg12. It has been reported that Atg16L1 expression is regulated by miR-142-3pin the human colonic epithelial cells [34]. Furthermore, other related studies have identified several miRs, including miR-93, miR-106B, miR-30C, miR-130a, miR-346, and miR-20a, that target Atg16L1 [30]. In particular, a recent study conducted with the aim of identifying the CD-associated miRs, involved in the host response to adherent-invasive Escherichia coli infection, revealed that the upregulation of miR-30C reduced the levels of Atg5 [35]. Having a wide variety of targets has made miR-181a participate in various biological processes, including development, differentiation, immunity, and inflammation [36,37]. With regard to the direct regulatory effect of miR-181 on Atg5, the present study was concerned whether there was any relationship between miR-181 circulating levels and the serum level of Atg5 in UC patients. However, because we did not observe any significant changes in the serum levels of Atg5 in UC patients versus HCs, we could not find a reasonable relationship between these 2 molecules. Since the present study is the first report on the circulating levels of miR-181a in UC patients, more studies need to investigate this issue in the future if we are to have more reliable information on this area.
We found a clear distribution of Atg5 in the colonic tissue samples in both patients and HCs groups, however, there were no statically significant difference between mentioned groups. Immunohistochemistry staining is one of the standard methods used broadly to detect autophagy-related proteins. Several studies, employing immunohistochemistry, have reported changes in the autophagy-related proteins in different diseases. In a recent study, immunohistochemistry and ELISA were recruited to assess the expression of Beclin1 in the colonic mucosa tissues of patients with UC. The results indicated that the expression of Beclin1 was significantly higher in the UC patients than in the control group [20]. Similarly, another investigation on Beclin1 and LC3B in the intestinal tissues of mice with IBD showed that there was a higher immunohistochemical reactivity for these 2 proteins in the IBD group compared to that of the controls [22]. In a study performed on UC and CD patients who endured 3 hours of hypoxia, the expression of p62 was measured using immunohistochemistry. Based on the results, there was an increase in the p62 expression and clearance in the colon of patients with CD, suggesting an acceleration in the autophagy turnover. Moreover, different responses to hypoxia, as one of the main autophagy inducers, were observed in CD and UC patients in the same study, implying the distinct pathophysiology of these diseases [38]. Owning to its momentous role in autophagy, Atg5 expression has been investigated throughout the immunohistochemistry staining in different diseases, including colorectal carcinoma [39] and oral squamous cell carcinoma [40]. Considering different pathophysiology and molecular entities of UC and CD, further studies on the pattern of Atg5 either in complex with other proteins (Atg16L1 and Atg12) or unaccompanied, in colonic tissues of these patients, with methods like immunohistochemistry, might provide us with valuable information that can be utilized for the diagnosis and differentiation of these main types of IBD.
Impaired autophagy manifests its consequences via perturbing the intestinal epithelial cells function, influencing the innate and adaptive immune responses, producing reactive oxygen species and endoplasmic reticulum stress, disturbing the bacterial killing, and secreting antimicrobial materials, which together can affect IBD initiation and development [41-43]. Due to its participation in different cellular processes, including canonical and non-canonical autophagy, adaptive and innate immune responses which themselves are suspicious partners in IBD pathogenesis, Atg5 has been studied extensively. In the present study, for the first time, we showed the presence of Atg5 in the fecal samples of UC patients and HCs. Considering the higher concentrations of Atg5 in UC patients versus non-IBD individuals, further investigation may provide us with some more convincing results that may lead us to use autophagy-related proteins as diagnostic biomarkers for IBD disease.