


INTRODUCTION
The 2 major forms of chronic IBD are CD and UC. CD is characterized by discontinuous regions of inflammation in the intestines; it occurs most frequently in the terminal ileum and colon, but can affect any part of the gastrointestinal tract from the mouth to the anus. The symptoms of CD are: abdominal pain, weight loss, and variable degrees of diarrhea. The inflammatory process of CD is transmural and, as a result, potential disease complications include intestinal fibrosis, strictures, and fistula formation. On the other hand, the inflammatory process of UC is limited to the mucosa and submucosa of the colon, with disease almost invariably involving the rectum. Diarrhea, hematochezia, tenesmus, and urgency of defecation are classic symptoms of active UC.
Both UC and CD are chronic conditions that have periods of remission and relapse. An accurate assessment of disease activity in patients with IBD is critical for appropriately managing the disease in clinical practice. In this regard, an apparent problem is that clinical indices do not always correlate with endoscopic or histological inflammation,1 and active enteric inflammation is often present in patients who do not present with any symptoms.2 Clinical indices such as CDAI for CD and Lichtiger's Clinical Activity Index for UC are mainly based on symptoms.3,4 However, these indices rely on the subjective assessment of patients, which may cause the biologic and/or endoscopic activity to be underestimated in patients with IBD.5,6 Therefore, current opinions increasingly cite the need to achieve both clinical response and endoscopic mucosal healing (MH) in the treatment of UC and CD.7,8,9,10,11,12,13,14,15
To adequately treat and manage IBD, physicians need to accurately understand the state of disease activity in each patient. Endoscopy is required to evaluate disease activity but the procedures are sometimes invasive and burdensome to patients. In addition, monitoring the mucosal status may require endoscopy to be repeated at different stages of the disease. Repeating endoscopy would add inconvenience, discomfort, and the risk of complications to the patients. Moreover, colonoscopic procedures may worsen the disease condition, even if the IBD patient is in remission.16 Therefore, alternative non-invasive methods for evaluating disease activity or predicting mucosal status are needed. In this context, blood, fecal, and radiologic assessment methods have been suggested and investigated.
As a pioneer for fecal surrogate makers, tests for fecal calprotectin (Fcal) are frequently conducted and its performance in clinical practice for IBD has been extensively investigated. In the meantime, we recently reported on the performance of a new approach to analyzing the feces of IBD patients, the fecal immunochemical test (FIT). FIT is widely used as a method to screen for colorectal cancer (CRC). Quantitative FIT can measure the concentration of hemoglobin in feces by using an antibody that targets human hemoglobin. Fcal estimates the degree of inflammation in the gut based on the amount of infiltrating inflammatory cells, whereas FIT measures the amount of blood hemorrhaging from the intestinal mucosa. Differences in the methodology that is used to evaluate mucosal status could lead to differences in the predictability of disease activity, MH, treatment efficacy, and risk of relapse in clinical cases of IBD. The aim of this review is to introduce FIT and its performance in clinical practice for IBD, and to compare the performances of FIT and Fcal.
MECHANISM AND PROCEDURE OF FIT
Screening for CRC was previously conducted by using guaiac-based fecal occult blood tests. FIT has since replaced guaiac-based tests because FIT has higher sensitivity for the detection of colorectal neoplasia.17 Although several kinds of single-use manual kits for FIT are available, automated analyzing systems with dedicated stool-sampling kits are currently made by several manufacturers. All available systems originated from antigen-antibody linking methods, like the ELISA. Currently, there are qualitative and quantitative systems for FITs, and quantitative systems can directly measure hemoglobin concentrations by using immunoturbidimetric methods.
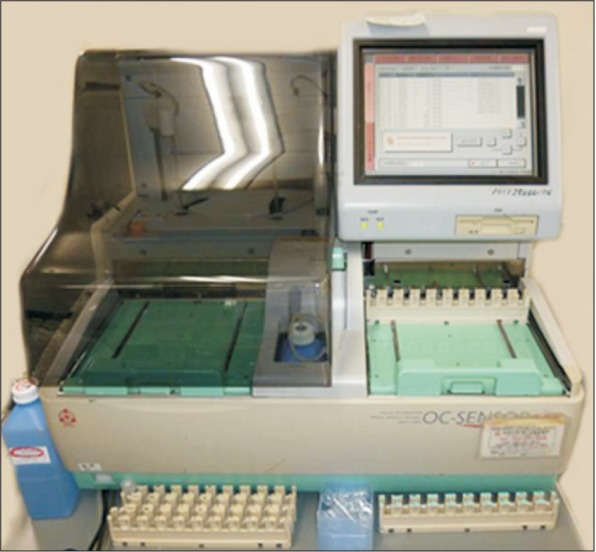
The sensitivity and specificity of a variety of FIT systems have been investigated in the field of CRC screening,18 but the only available data in clinical practice for IBD was collected by using the OC-sensor system (Eiken Chemical, Tokyo, Japan). The OC-sensor system is the most popular FIT system both in Japan and in Western countries for CRC screening. This system records measurements based on latex agglutination immunoturbidmetry. FIT systems (including the OC-sensor system) consist of an automated analyzer and dedicated sampling kits. The automated analyzer is available in machines set-up for several different scales, which have different performance in the amount of throughput that it can manage in a single session. Fig. 1 illustrates the complete OC-sensor DIANA, which can measure up to 150 samples in a single session.
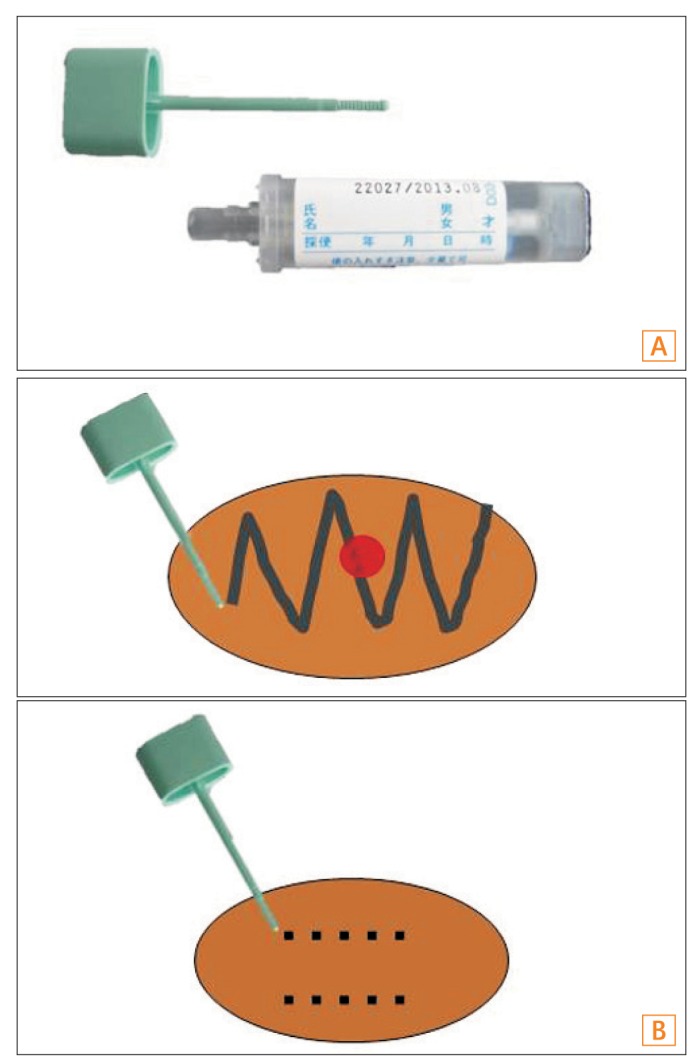
To perform an analysis using the OC-sensor system, patients are required to collect stools by using the dedicated sampling probe (OC-hemodia sampling probe, Eiken Chemical). An 8×2 cm test-tube-shaped container holds the sampling probe (Fig. 2A), and the container is filled with 2 mL of a hemoglobin-stabilizing buffer solution that contains a latex antihuman hemoglobin antibody reagent. To collect stool, patients insert the sampling probe into several different areas of the stool sample (Fig. 2B), and then firmly place the probe back into the tube to seal it. Generally, submitted stool samples are immediately processed and examined via the automated analyzer, but the hemoglobin concentrations in the buffer are stable for at least 3 days at room temperature. After testing the container with a stool-collected sampling probe with the automated analyzer, the measurement results can be obtained within 7 minutes, without the need for any other operations by technicians.
The OC-sensor analyzer can accurately measure fecal hemoglobin concentration in 50-1,000 ng/mL buffer. Fecal specimens with a hemoglobin concentration over 1,000 ng/mL buffer can be measured after dilution. On the other hand, FIT results are inaccurate when the hemoglobin concentration is <50 ng/mL buffer, and concentrations <50 ng/mL buffer are usually categorized as a "negative result".
CLINICAL APPLICATIONS OF FIT
1. Performance of FIT for UC
Currently, there are few reports that describe the performance of FIT for IBD, even though several IBD physicians in Japan have used it in clinical practice. In Japan, the prevalence of FIT use in clinical practice for IBD may be attributable to the widespread availability of FIT automated analyzers among major hospitals, as they are used for the purpose of CRC screening. Most IBD physicians that conduct FITs use it to monitor disease activity in patients at each patient visit.
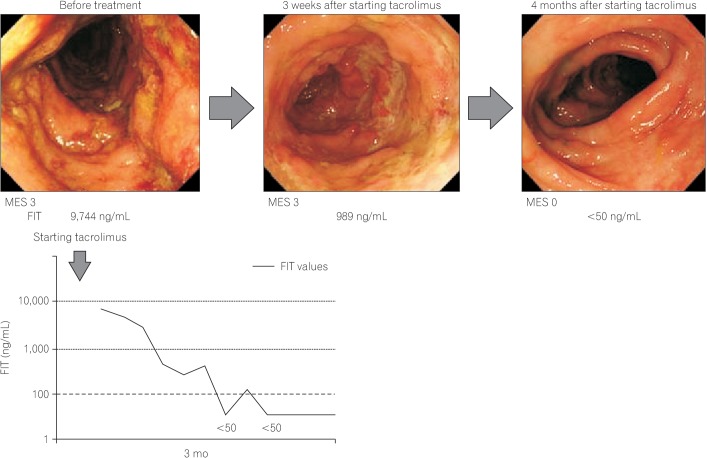
The seminal report regarding the performance of FIT in clinical practice for IBD was published in 2013.19 In this report, a comparison between the results of a FIT and colonoscopy in UC patients was performed, and it was shown that FIT results accurately reflected the mucosal status in UC (Fig. 3). The main purpose of the study was to show the predictability of FIT for MH, and a negative FIT result predicted MH, which was defined as Mayo endoscopic subscore (MES)=0, with 92% sensitivity and 71% specificity.
2. Performance of FIT for CD
The performance of FIT for CD was examined in a cohort that was smaller than the one for UC.20 CD can involve the small intestine, and it is generally difficult to evaluate the activity in the small intestine with precision. In that study, to attain the most accurate evaluation of the small bowel, CD patients with small bowel lesions were examined with balloonassisted enteroscopy. The results showed that the FIT results significantly correlated with endoscopic activity in CD (Spearman rank correlation coefficient [r]=0.54, P<0.0001). However, the correlation was poor in patients who did not have colonic involvement (r=0.42, P=0.051), perhaps because FIT is optimized to detect bleeding in the colorectum for the purpose of CRC screening. This idea is supported by the fact that FIT is generally less sensitive to neoplasia in the proximal colon than to neoplasia in the distal colon.21
COMPARISON OF FIT AND FCAL AS A BIOMARKER OF IBD
1. Summary of the Fcal Performance in Clinical Practice for IBD
Calprotectin is a major protein found in the cytosol of inflammatory cells. Extensive investigation has been carried out to determine the correlation between calprotectin in feces and the disease status of IBD. Shoepher et al. reported that Fcal values were more strongly correlated with endoscopic activity in UC than clinical symptoms or blood markers, and showed that the Fcal with the cutoff value of >50 µg/g had the best performance in sensitivity (93%), specificity (71%), and accuracy (89%) for the detection of endoscopically active disease.22 Another study reported that a Fcal cutoff >250 µg/g gave 71% sensitivity and 100% specificity for active mucosal disease activity in UC.23
The correlation between Fcal and mucosal status in CD has also been investigated. There have been 3 moderate scale studies (including approximately 100 ileocolonoscopies) conducted, but each study identified a different cutoff value for predicting mucosal inflammation/healing.23,24,25 A recent study showed that levels <250 µg/g predicted endoscopic remission with 94% sensitivity and 62% specificity.23 Another study showed that a cutoff level of 200 µg/g predicted endoscopically active disease with 70% sensitivity and 92% specificity.24 In contrast, the cutoff of the third study was relatively low (70 µg/g) and the value predicted endoscopically active disease with 89% sensitivity and 72% specificity.25
Therefore, Fcal has performed relatively well in predicting the disease activity of IBD. However, there are problems that relate to variation in cutoff values and definitions of disease activity between different studies. In this context, to evaluate the performance of FIT against Fcal in IBD, a direct comparison using the same cohort is required.
2. Comparison of FIT and Fcal in Predictability of MH
A previous study compared the performance of Fcal and fecal hemoglobin concentration in predicting active endoscopic inflammation in patients with CD and UC.26 Fcal and fecal hemoglobin concentration were measured by using ELISA, and it was found that both Fcal and fecal hemoglobin concentration were equivalent in their accuracy for identifying active endoscopic inflammation. Although hemoglobin concentrations were measured with ELISA and not FIT, fecal hemoglobin appeared to be a promising alternative to Fcal.
Most of the studies regarding fecal markers for IBD evaluated the presence of mucosal inflammation but not MH. Consequently, those studies showed a positive correlation between values of fecal markers and endoscopic activity, and have demonstrated that fecal proteins could predict mucosal inflammation rather than MH. However, in IBD, particularly in UC, surrogate markers for active inflammation are not necessary in most clinical situations, because physicians may precisely understand the active disease based on patient symptoms alone.27 Therefore, in surrogate markers, predictability for MH is more important than predictability for active disease, because the disappearance of symptoms is not always an indication of MH. Nonetheless, studies that report predictability of Fcal for MH have relatively been scarce. Only recently, Theede et al. reported that Fcal with the cutoff 192 µg/g predicted MH, where MH was defined as MES 0, with 75% sensitivity and 88% specificity.28
Based on this background, we have shown the data of the direct comparison of predictability for MH in UC between the FIT and Fcal.29 In that study, 105 colonoscopies in 92 patients with UC were evaluated in conjunction with the FIT and Fcal results. Both FIT and Fcal results significantly correlated with endoscopic activity (Fig. 4A). In addition, FIT results correlated with the results of Fcal (Fig. 4B). Although the predictability for MH was similar between the 2 markers, FIT appears to be more sensitive than Fcal for predicting MH, when a stricter definition of MH is applied (MES 0 alone; FIT, 95% sensitivity; Fcal, 82% sensitivity).
Up to now, the definition of MH is still not well-established. In particular, it remains controversial whether MES 0 or 1, or MES 0 alone should be regarded as MH. Older reports were likely to define MH as MES 0 or 1,8,30,31,32 whereas more recent studies have defined MH as MES 0 alone.33,34,35 MH should be determined in correlation with prognosis including the risk of relapse and colectomy. In this regard, some studies reported that the prognosis of patients with MES 0 did not differ from that of patients with MES 1,8,31,32 whereas others showed a significant difference in prognosis between patients with MES 0 and those with MES 1.33 In a previous study, we also observed a significant difference in the risk of relapse between patients under each definition of MH.35 In this regard, high sensitivity to MH under a stricter definition of MH may influence the predictability of the 2 fecal markers for the risk of relapse.
We also evaluated the predictability of MH in CD of the two fecal markers by performing a similar study where a direct comparison was made.20 Although the sensitivity of FIT and Fcal for MH in CD was equivalent, FIT was less sensitive for MH in CD with lesions in the small intestine alone (r=0.42; P=0.051 vs. 0.78; P<0.0001). A likely reason for the lower sensitivity of FIT for lesions in the small intestine is its optimization for bleeding in the colorectum argued in the above paragraph, and improvement and optimization for IBD would make FIT more sensitive to lesions in the small intestine.
3. Comparison of FIT and Fcal in the Predictability of Therapeutic Efficacy
Changes in the value of fecal markers following therapy may be a good parameter to assess the effect of the drug on the underlying inflammation. A decrease in the value of fecal markers in response to therapy is objective evidence that the drug has a beneficial effect on gut inflammation even in patients who have little change in symptoms. In this regard, monitoring of fecal markers such as Fcal in patients with CD after the initiation of anti-tumor necrosis factor-α antibody therapy could predict treatment efficacy and MH.36
In contrast, there have been no published studies to show that monitoring fecal blood or hemoglobin levels by FIT predicts the efficacy of therapeutics. However, Japanese physicians using FIT in clinical practice are generally aware that FIT values shift to negative along with the efficacy of therapy. The clinical course of a patient where treatment efficacy was monitored by FIT is shown in Fig. 5.
4. Comparison of FIT and Fcal in Their Predictability of the Risk of Relapse
Fecal markers could potentially predict the risk of relapse because the markers may detect subtle inflammation in the gut, which does not manifest as patient symptoms. In the clinical practice for IBD, the most suitable application of biomarkers such as fecal markers is in monitoring asymptomatic patients, to allow the early detection of subclinical relapse. Although many physicians would consider this to be the best application of fecal markers, there are few clinical studies to prove the advantage of this approach. This may be due to the difficulty in constructing the most appropriate study design.
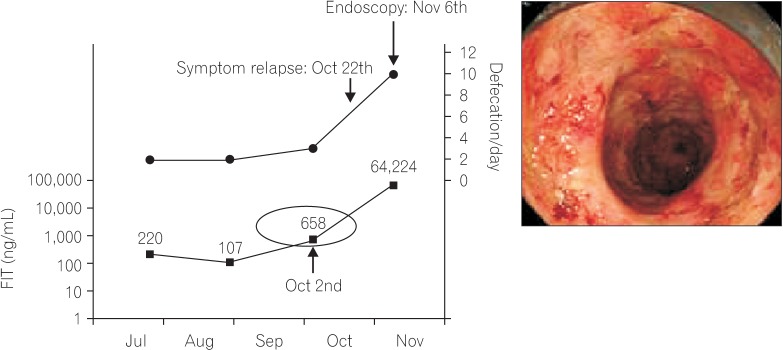
We previously reported that FIT results became higher at 1 or 2 months prior to clinical relapse in some UC patients.37 This is illustrated in Fig. 6, which shows the clinical course and FIT results of a patient where the increase in FIT value is apparent before relapse. The ability of Fcal to predict relapse was also reported.38,39 However, in those studies Fcal in each patient was not frequently measured, perhaps due to its high cost. Recently, De Vos et al. reported that consecutive Fcal measurements in patients with UC who were undertaking infliximab therapy allowed the detection of relapse at 3 months prior to the appearance of symptoms.40 To prove whether the FIT or Fcal performs better in the earlier detection of subclinical relapse, well-designed clinical studies are needed.
5. FIT vs. Fcal: Other Critical Issues
IBD lasts for a lifelong period, and patients often experience disease relapse at some point in the duration of the disease. Therefore, repeat monitoring of disease activity (by using any method) is necessary. Repeated examinations may physically and economically burden the patients. Here, we compare FIT and Fcal in terms of its patient-friendliness, including factors such as test stability, cost, and examination speed.
One of the advantages of the FIT over Fcal is the test stability. The cutoff values of Fcal for the presence or absence of inflammation varies among studies and the kits that are used. In contrast, the cutoff value of FIT is relatively stable, and is almost equivalent to the cutoff used in CRC screening. In addition, the predictive performance of FIT does not vary largely as a result of the cutoff value selection. Due to the test stability, FIT can be used in a similar way amongst different institutes, and the results can be held in common among physicians. Thus, the universal nature of the FIT is a great advantage.
Because Fcal is analyzed by ELISA, the cost of one sample is relatively high, at approximately $180/sample. In contrast, the cost of a FIT is only approximately $20/sample, and most of the cost is attributable to the cost of the sampling tube. Although the automated analyzer is relatively expensive (approximately $50,000), the equipment could be provided on a lease. A lower examination cost allows more frequent assessments to be conducted, resulting in more meticulous follow-up of patients and the possible decrease in cases of severe relapse.
High speed, high throughput, and the ability to obtain results onsite are some advantages of the FIT, although the speed of Fcal examination has also increased, compared to that during its use in the past.41,42 FIT results can be obtained within 10 minutes and physicians can refer to the results in making a medical decision during the patient visit. In contrast, Fcal takes more than several hours by ELISA. In this regard, FIT is more practical than the rather pedantic method of Fcal examination.
Lastly, the automated system and dedicated sampling kits containing buffer are unique for FIT. This packaged system has several advantages. First, sampling errors are less likely to occur. The sampling kit of any FIT system usually includes detailed instruction for collecting stools, and sampling stool by using the probe from any kit is simple for anyone to do. Second, the submitted samples can be measured by a specific automated analyzer simply by setting the kit tube into the equipment. Therefore, laboratory technicians do not need to touch stools and buffers, and measurement errors are less likely to occur. These advantages of FIT would yield stable and reliable results, which is very important in clinical practice.
PERSPECTIVES IN THE FUTURE
In the field of CRC screening worldwide, guaiac-based manual measurement of fecal occult blood has been replaced by FIT with automated measurement systems, because of their higher performance, ease of use, low-cost, and cleanliness. Looking into this phenomenon in the field of CRC screening, the use of FIT for IBD may be foreseeable in the near future.
First, FITs other than the OC-sensor system would be available. In the field of CRC screening, the pioneer and the most widely used quantitative system of FIT has been the OC-sensor system. Currently several manufacturers make different many FIT systems for their use in CRC screening. Future investigations would study the performance of these FIT systems for IBD.
In the field of CRC screening, the 2 or 3 day-method, i.e., analysis based on 2 or 3 fecal samples, reportedly increased the sensitivity for detection of colorectal neoplasia.43 In IBD, a similar study to evaluate how the number of examined fecal samples affects the test performance has not been conducted. Even when using the sampling kit, the collection of fecal samples appears to be more difficult in patients with IBD than in patients that undergo CRC screening, because stools from IBD patients have various forms and are sometimes watery. Therefore, future studies should analyze how well FIT performs when multiple samples are examined.
Current fecal markers, including Fcal, are measured by ELISA, which is generally performed manually. Most fecal markers are proteins that are found in stools; therefore, these markers could be measured by using automated analysis equipment similar to that in the FIT system. In fact, some manufacturers appear to be developing a machine which can simultaneously measure FIT, Fcal, and other fecal proteins in a single stool sample.
Currently, FIT does not perform sufficiently well in detecting lesions in the small intestine of patients with CD. The low ability to detect lesions in the small intestine is probably due to the low sensitivity of FIT to bleeding on the oral side of the intestine. Although the lower limit of measurement by the OC-sensor is 50 ng/mL buffer, the limit could become lower due to advances in the performance of analyzers. The development of new FIT systems by other manufacturers could allow for the detection of subtle bleeding. For the application of FIT in CRC screening, cutoffs that are too low may result in lower specificity for neoplasia, leading to higher falsepositive rates. However, for the use of FIT in IBD, lower cutoffs may not negatively impact clinical practice because the absolute value is not the most clinically relevant information. In clinical practice for IBD, changes in the FIT value over the course of the disease are more clinically relevant compared to an absolute value of FIT at a single patient visit. Therefore, if lower cutoffs could allow FIT to detect changes more accurately, it may be useful in clinical practice.
CONCLUSIONS
Here, we provided an overview of the performance of FIT in clinical settings of IBD. Fcal is still the mainstay of the fecal markers for IBD, because the marker is now widely used in Western countries. However, in the field of CRC screening, the guaiac-based fecal test, which was widely used in Western countries, has been replaced by FIT. The application of FIT as a method for CRC screening was initially approved in Asian countries and is now widely used, because automated measurement systems have been mainly developed in Asian countries such as Japan. Since manufacturers of FIT systems have started marketing activities worldwide, FIT use has also become prevalent in areas outside of Asia. Unfortunately, researchers in Asian countries that are involved in cancer screening have not disseminated the usefulness of FIT to the world. Therefore, data of FIT for CRC screening have been presented by Western researchers who only became aware of the usefulness of FIT after marketing by the manufacturers of FIT systems. FIT appears to be promising as an alternative method to evaluate stools in the field of IBD, because the concept of evaluating inflammation is quite different from that of other methods, including Fcal and lactoferrin. The fundamental difference from earlier methods may yield more important insights in the clinical practice of IBD. We hope that more clinicians and researchers in the Asian and Western countries understand the usefulness of FIT in IBD, use the systems in clinical practice, and collect and disseminate the data to all over the world.