


INTRODUCTION
Inflammatory bowel disease (IBD), including UC and CD, is a GI disorder with a chronic and recurrent inflammatory process that requires lifelong treatment. IBD is highly prevalent in developed countries, such as North America and Europe, and affects up to 0.5% of the general population. Despite previous low incidence rates, Asia has experienced a meaningful increase in IBD incidence over the last 20 years, whereas Europe is experiencing a stagnation or decline [1,2]. Patients with IBD may have a variety of symptoms, such as diarrhea with blood and mucus, abdominal pain, and fatigue, that reduce the quality of life [3]. There is much interest in the nutritional status of patients with IBD, and efforts are needed to improve nutritional status [4-6].
Vitamin D deficiency is more common in patients with IBD than in the general population. The incidence of vitamin D deficiency in IBD patients ranges from 16% to 95%, and is known to frequently occur in CD than in UC [7-10]. Many factors can contribute to vitamin D deficiency, such as malabsorption, reduced exposure to sunlight, lack of physical activity, reduced dietary and vitamin D intake, and smoking [11,12]. The most stable form of measurement of vitamin D in serum is 25-hydroxyvitamin D (25-OH vitamin D), and its level reflects the vitamin D provided by sun exposure, dietary intake, supplementation, and storage.
Several epidemiological studies have found a significant inverse relationship between vitamin D level and the development of IBD [7-9]. Although the effects of vitamin D supplementation on the outcome of the disease and the timing of proper vitamin D supply are not yet clear, several studies suggest that vitamin D plays an important role in the course of IBD [11,13,14].
This study aimed to determine the correlation between serum vitamin D level and disease activity in patients with IBD.
METHODS
1. Patients
Our study was performed in the gastroenterology clinic of Inje University Seoul Paik Hospital for patients diagnosed with UC or CD from January 2000 to December 2017. The diagnosis of UC or CD was made based on the diagnostic guideline suggested by the IBD study group of the Korean Association for the Study of Intestinal Disease [15,16]. The medical records of the enrolled patients were retrospectively analyzed, including demographic, laboratory, endoscopic, radiological, pathological, and other clinical data. Patients were excluded if they had no data of serum vitamin D level or had comorbidities affecting serum vitamin D levels (i.e., renal failure, liver disease, lactation, pregnancy, medications, such as vitamin D supplements and anticonvulsants). The 80 of normal control group was selected based on age and sex among those had normal colonoscopy finding and serum vitamin D level was measured during health checkup in 2017 at Seoul Paik Hospital of Inje University. Among them, 63.8% (51/80) were men, with a mean age of 40.4┬▒13.6 years (range, 29-73 years). The study was conducted after the approval of the Ethics Committee of Seoul Paik Hospital of Inje University (IRB File No. 2017-12-007). Informed consent was waived.
2. Measurements
PatientsŌĆÖ characteristics including disease duration, location and behavior, IBD-related surgeries, and medical history were obtained from the clinical records. Physical examinations were performed, and height and weight were measured on single calibrated scales. Hemoglobin, white blood cell counts (WBC), CRP, ESR, albumin, and cholesterol levels were also measured as indicators of inflammation and disease severity on the same day vitamin D level was measured. Medication history has been checked for cumulative drugs used since the disease was diagnosed.
Vitamin D status was obtained through measurement of serum 25-OH vitamin D level by using a fully automated immunoassay (ADVIA Centaur XP┬«, Siemens, Munich, Germany) because it was considered as the best measurement of an individualŌĆÖs vitamin D status [10].
3. Definitions of Disease Activity and Vitamin D Deficiency
The primary outcome was the association of vitamin D deficiency with IBD disease activity. Disease activity was assessed using the partial Mayo score and Harvey-Bradshaw index (HBI) for UC and CD, respectively. The partial Mayo score includes reported stool frequency, presence of rectal bleeding, and a global assessment of the physician. The HBI includes general well-being, number of liquid stools per day, abdominal pain, abdominal mass, and complications. For UC, a partial Mayo score of 2 or higher was defined as active disease. In CD, an HBI score of <4 was defined as clinical remission, and a score of 4 or higher was defined as active disease [17-21]. The patients were classified based on their serum 25-OH vitamin D levels. Vitamin D deficiency was defined as vitamin D level of <20 ng/mL [22].
4. Statistical Analysis
Data were analyzed using the SPSS software version 24.0 (IBM Corp., Armonk, NY, USA). Consecutive variables were summarized using mean and standard deviation, and categorical variables were represented by the corresponding numbers and ratios. We used independent sample t-test to compare quantitative data. Correlations between variables were verified by the Fisher exact test. Binary logistic regression, for disease activity and vitamin D level, was adjusted considering independent variables, such as age, sex, BMI, smoking, disease duration, and laboratory variables (serum vitamin D, hemoglobin, WBC, ESR, CRP, and albumin). A P-value <0.05 was considered statistically significant.
RESULTS
1. Baseline Characteristics
We enrolled 87 patients with IBD in this study (UC, 45; CD, 42). Among them, 65.5% were men, with a mean age of 44.9┬▒15.1 years (range, 18-75 years). The mean duration of the disease was 4.7┬▒4.8 years (range, 0.1-17.1 years). 5-ASA, prednisolone, immunomodulators, and anti-TNF therapy were administered in 98.9%, 56.3%, 56.3% and 32.2% of patients, respectively. Five patients (5.7%) underwent small bowel resection and colectomy for complications, such as stenosis, recurrent hemorrhage, and abscess. Table 1 shows the demographic data and clinical characteristics of the patients.
2. Vitamin D Levels
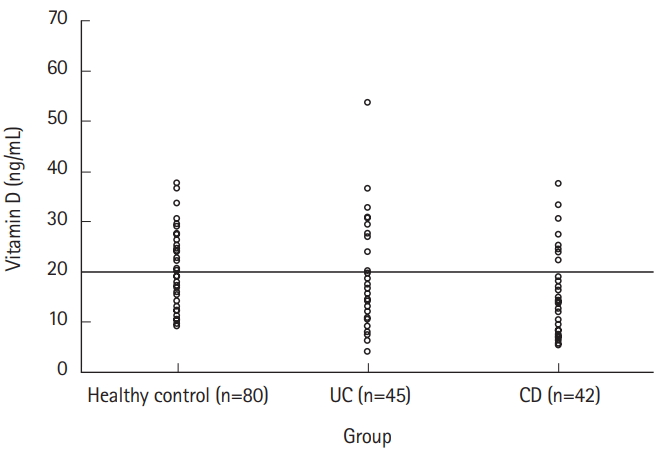
Vitamin D deficiency (<20 ng/mL) was found in 73.6% of patients with IBD (UC, 73.3%; CD, 73.8%). Patients with IBD showed a lower mean of vitamin D level (16.3┬▒9.0 ng/mL) than the healthy control group (20.4┬▒7.0 ng/mL), with no statistically significant difference (P=0.136) (Fig. 1).
The mean vitamin D level in patients with CD was lower than that in those with UC, which was not statistically significant (15.4┬▒8.2 ng/mL vs. 17.1┬▒9.7 ng/mL, P =0.640) (Fig. 1).
In the univariate analysis, the age of patients in the vitamin D deficiency group was significantly younger (41.3┬▒15.8 years) than that of those in the normal group (52.6┬▒10.6 years) (P=0.011), but sex, BMI, duration of disease, disease location, drug use, and surgery were not significantly associated with serum vitamin D level. Also, the presence of anemia, leukocytosis, higher ESR and CRP levels, and lower albumin and total cholesterol levels were not significantly associated with vitamin D levels. Meanwhile, in the binary logistic regression analysis, age and disease activity were independently associated with vitamin D levels and the ORs were 0.96 (P=0.023; 95% CI, 0.92-0.99) and 5.06 (P=0.044; 95% CI, 1.04-7.59) (Table 2).
3. Vitamin D and Disease Activity
Among the enrolled patients with IBD, 27 (31.0%) and 60 patients (69.0%) had active disease and were in remission, respectively. Compared with patients in remission, those with active disease had more frequent use of steroid and immunomodulators (74.1% vs. 48.3%, P=0.035), as well as biological therapy (55.6% vs. 21.7%, P=0.003), lower serum vitamin D level (11.4┬▒6.3 ng/mL vs. 18.1┬▒9.2 ng/mL, P=0.012), and more frequent vitamin D deficiency (95.8% vs. 65.1%, P=0.003) in the univariate analysis. With regard to serological biomarkers, patients with active disease were found to have higher WBC count, ESR, and CRP levels than those who were in clinical remission. However, in the binary logistic regression analysis, only low levels of vitamin D were independently associated with disease activity, with an OR of 0.91 (P=0.028; 95% CI, 0.84-0.99).
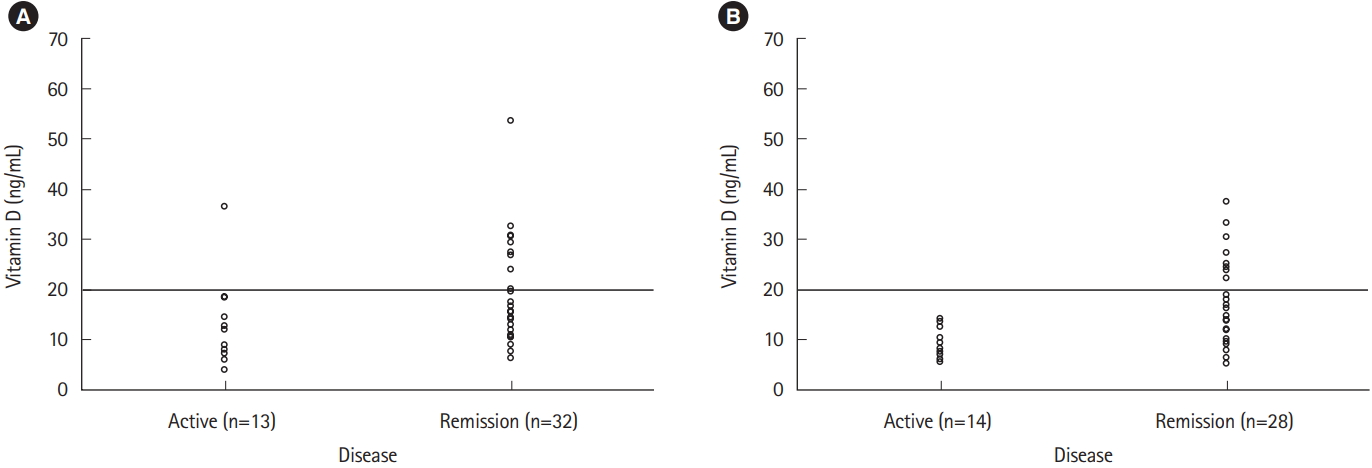
On subgroup analysis, only patients with CD with active disease had lower serum vitamin D level (9.6┬▒2.9 ng/mL vs. 18.3┬▒8.5 ng/mL, P=0.001) and more frequent vitamin D deficiency (100% vs. 60.7%, P=0.007) than patients in clinical remission, which was statistically significant (Table 3).
Disease activity was inversely correlated with vitamin D deficiency in patients with CD (P=0.007). However, no correlation was observed in patients with UC (P=0.134) (Fig. 2).
DISCUSSION
The sources of vitamin D are the synthesis of the skin through sunlight and the intake of food or supplement containing vitamin D. Although the main cause is still unclear, patients with IBD have a higher incidence of vitamin D deficiency than the general population [23]. In this study, we identified the same results as several previous studies that reported a higher vitamin D deficiency incidence in IBD. The incidence of vitamin D deficiency in patients with IBD in our study (73.6%) was relatively higher than that reported in a previous retrospective American study (49.8%) [9], but lower than that in the recent study conducted in Korea (89.2%) [24]. These results are consistent with previous findings that Asian people tended have a higher incidence of vitamin D deficiency than Caucasians [25]. In addition, differences in research results may be due to other criteria for defining low vitamin D levels and environmental factors, and patient characteristics such as demographics, physical activity, and nutritional status. In our study, we considered albumin and cholesterol levels as indicators of nutritional status and investigated the association with vitamin D deficiency. However, we could not find a significant relationship between albumin and cholesterol level and vitamin D level, so we assumed that vitamin D deficiency was not caused by malnutrition.
There are several causes for vitamin D deficiency. Some studies show that lack of exposure to sunlight can be an important cause of vitamin D deficiency in patients with IBD, particularly from northern climates. They demonstrated that an association was found between winter season and vitamin D deficiency due to low sunlight and UV-B exposure [26]. Inadequate physical activity in patients with chronic illness, known as another risk factor associated with vitamin D deficiency. In addition, bowel resection is found to be associated with vitamin D deficiency owing to the discontinuation of the enterohepatic circulation in the terminal ileum, interrupting the absorption of fat-soluble vitamins, such as vitamin D [27,28]. However, those studies have not persistently investigated the effect of bowel resection on vitamin D deficiency, and our results also did not find a significant correlation between bowel resection and vitamin D deficiency (P=0.319). In addition, vitamin D levels and location of IBD lesions are not significantly related in this study (P=0.463).
Few reports have evaluated the effect of vitamin D supplementation on the clinical course of IBD in clinical trials. A recent American study investigating 138 patients showed that patients who did not receive vitamin D supplementation had lower levels of vitamin D and more frequent use of the health care system [29].
In some other studies, inflammatory activity of CD has been found to be associated with vitamin D deficiency. Some researchers claimed that low vitamin D levels are associated with active disease [29,30], whereas others do not [31]. Finding this association is complicated because of the many variables in assessing disease activity.
In contrast, studies on disease activity in UC and vitamin D deficiency are insufficient, with conflicting results. Although our study and a Romanian study observed that no association was found between vitamin D deficiency and disease activity, an American study of 34 patients with UC showed that they were associated [32,33]. In addition, in a recent cohort study of 368 patients with UC, patients with normal vitamin D levels had significantly lower disease activity, but no association was found between systemic markers of inflammation and vitamin D levels [29].
This study found an inverse correlation between low vitamin D levels and disease activity in patients with CD. We observed that patients with CD with low vitamin D levels had significantly higher disease activity measured by HBI. However, such association was not observed in patients with UC. These results were consistent with a large retrospective study of 200 outpatients with IBD at a Norwegian research institution (UC, 78; CD, 122) [34].
Other variables, particularly ESR, CRP, and albumin levels, were associated with clinical disease activity, but no significant association was found between serum vitamin D status and inflammatory markers (ESR, CRP, and leukocytes) in our study. These results can be supported by the theory that serum vitamin D levels can reflect local inflammation in tissues rather than systemic inflammation, but further studies are needed to clarify the relationship [30]. Meanwhile, a recent study evaluated fecal calprotectin, which showed a significant inverse correlation with vitamin D levels [30,35].
Our study has one interesting finding. The risk of vitamin D deficiency is generally high in the elderly, but in our study, vitamin D deficiency was significantly higher in the younger age. A recent American cohort study of patients with IBD also found the similar results [29]. These findings may have been presumed to be caused by intake of vitamin D-containing nutrients without prescription or by differences in lifestyle and eating habits.
Our investigation has some limitations. First, this study was retrospective and performed on a limited number of patients at a single outpatient clinic; hence, the results were difficult to generalize. In addition, previously limited screening conditions and cost problems have not led to the examination of intestinal inflammatory markers, such as fecal calprotectin in many patients with IBD, which can provide better information on disease activity. Furthermore, we did not evaluate the influence of vitamin D supplementation on disease activity, patient symptoms, quality of life, and treatment changes.
In conclusion, vitamin D deficiency is frequently found in patients with IBD. In addition, vitamin D deficiency is associated with increased disease activity in patients with CD. However, no significant association between vitamin D levels and serum inflammatory markers was found. Because of the high rate of vitamin D deficiency in patients with IBD, appropriate vitamin D screening and supplementation with proper amounts of vitamin D may be helpful. More large prospective studies and clinical trials are needed to clarify the role of vitamin D in the clinical course of patients with IBD and to recognize its importance.