Skip Navigation
Skip to contents

Intest Res : Intestinal Research

IMPACT FACTOR

Articles

Page Path
HOME > Intest Res > Volume 16(4); 2018 > Article
Original Article Usefulness of fecal immunochemical test and fecal calprotectin for detection of active ulcerative colitis
Dong Ju Kim1, Yoon Mi Jeoun2, Dong-won Lee1, Ja Seol Koo1,, Sang Woo Lee1
Intestinal Research 2018;16(4):563-570.
DOI: https://doi.org/10.5217/ir.2018.00020
Published online: October 10, 2018

1Department of Internal Medicine, Korea University Ansan Hospital, Ansan, Korea

2Department of Psychology, Hwashin Cyber University, Busan, Korea

Correspondence to Ja Seol Koo, Department of Internal Medicine, Korea University Ansan Hospital, 123 Jeokgeum-ro, Danwon-gu, Ansan 15355, Korea. Tel: +82-31-412-4853, Fax: +82-31-412-5582, E-mail: jskoo@korea.ac.kr
• Received: February 12, 2018   • Revised: May 21, 2018   • Accepted: June 5, 2018

© Copyright 2018. Korean Association for the Study of Intestinal Diseases. All rights reserved.

This is an Open Access article distributed under the terms of the Creative Commons Attribution Non-Commercial License (http://creativecommons.org/licenses/by-nc/4.0/) which permits unrestricted non-commercial use, distribution, and reproduction in any medium, provided the original work is properly cited.

prev next
  • 8,291 Views
  • 189 Download
  • 11 Web of Science
  • 11 Crossref
  • 10 Scopus
  • Background/Aims
    Ulcerative colitis undergoes periods of exacerbation and remission. Fecal calprotectin levels increase with gut inflammation and correlate with endoscopic disease activity in ulcerative colitis. Intestinal blood loss and fecal immunochemical test levels also correlate with endoscopic disease activity. This study statistically evaluated the usefulness of fecal calprotectin, fecal immunochemical test, and C-reactive protein (CRP) as markers of disease activity.
  • Methods
    A total 106 ulcerative colitis patients who underwent endoscopy and fecal calprotectin, fecal immunochemical test, and CRP testing, from March 2015 to August 2016, were retrospectively reviewed. Disease activity was assessed using a partial Mayo score and Mayo endoscopic score. The ability of fecal and serologic tests to reflect endoscopic disease severity was statistically evaluated.
  • Results
    Among 106 patients, 68 underwent endoscopy and stool study within 2 weeks. In patients with mild to severe activity, fecal immunochemical test and fecal calprotectin were superior to CRP at Mayo endoscopic score detection rate. The area under the curves of fecal immunochemical test and fecal calprotectin for the detection of Mayo endoscopic score ≥1 were 0.956 and 0.942, respectively, and were superior to that of CRP (0.756). At Mayo endoscopic score, the effects of combination of fecal immunochemical test and CRP or fecal calprotectin and CRP were found to be higher than those of the independent fecal immunochemical test or fecal calprotectin.
  • Conclusions
    Fecal immunochemical test and fecal calprotectin can effectively detect active ulcerative colitis better than remission. As these markers reflect the status of mucosal inflammation, they may reduce the requirement for invasive endoscopic examination.
Ulcerative colitis (UC) is a type of IBD, and undergoes periods of exacerbation and remission. The evaluation of disease activity has depended on clinical symptoms, but the gold standard is colonoscopy, because clinical symptoms are relatively inaccurate for assessing disease severity at the tissue level [1].
Given that colonoscopy can be a noteworthy undertaking for the doctors and may bring about patient’s inconvenience, more straightforward and dependable surrogate markers of intestinal exacerbation would be useful. If the biomarkers reflect the status of mucosal inflammation and symptoms well, they may reduce the need for invasive endoscopic examination.
Calprotectin is a 24-kDa dimer of calcium-binding proteins. The complex accounts for up to 60% of the soluble protein content of the neutrophil cytosol [2].
The fecal level of calprotectin increases with gut inflammation when neutrophils infiltrate the mucosal tissue in large numbers [3]. Fecal calprotectin (FC) levels correlate significantly with endoscopic disease activity in IBD [4]. Additionally, FC predicts clinical relapse of disease activity in patients with IBD [5].
Quantitative fecal immunochemical test (FIT) has good sensitivity and specificity for detection of clinically significant neoplasia [6]. Since occult intestinal blood loss is a meaningful symptom in patients with IBD, FIT could potentially be used as a marker for mucosal inflammation in these patients. A recent report on patients with UC revealed that the concentration of FIT correlated well with the endoscopic severity of inflammation [7].
Whether FIT is inferior or superior to calprotectin in distinguishing patients with mucosal inflammation is unclear. In this study, we evaluated the usefulness of FC, quantitative FIT, and CRP as markers of UC disease activity.
1. Patients
Among 267 patients who visited Korea University Ansan Hospital for the management of UC at least once, 106 patients (39.7%) who visited from March 2015 to August 2016 were included in this study. A total 106 UC patients underwent FC, FIT, CRP, and endoscopy evaluation. FIT and FC were checked routinely for the management of UC in our clinical practice.
At this study, we evaluated single time estimation of FC, FIT and CRP in relation to endoscopic disease activity as far as possible, but some patients of different time estimation were present due to patient status. Among the 106 patients, 68 had intervals of less than 2 weeks between endoscopic examination and stool studies.
The Mayo score uses stool frequency, rectal bleeding, endoscopy, and physician global assessment to evaluate the severity of UC. The partial Mayo score is composed of 3 variables (stool frequency, rectal bleeding, and physician global assessment). The partial Mayo score is the sum of the 3 variables. Partial Mayo scores of 0 and 1 are assigned to remission; 2 to 4 are assigned to mild disease; 5 and 6 are assigned to moderate disease; and 7 to 9 are assigned to severe disease.
Among 106 UC patients, 68 had intervals of less than 2 weeks between endoscopic examination and stool studies. Surveillance colonoscopy was performed by 4 experienced gastroenterologists. One central author reviewed endoscopic severity with blinding clinical data. The endoscopic disease severity and extent of inflammation in all segments of the colon (cecum and ascending colon combined, transverse colon, descending colon, and rectosigmoid combined) were evaluated on colonoscopy. Endoscopic disease severity was scored as normal to 0, mild (erythema, decreased vascular pattern, and mild friability) to 1, moderate (marked erythema and absent vascular pattern) to 2, and severe (spontaneous bleeding and ulceration) inflammation to 3, in accordance with the Mayo endoscopic score [8].
In our observational study, patients collected stool samples prior to colonoscopy and the samples were stored at –20°C until assay. After bowel preparation, patients underwent total colonoscopy, and the endoscopic component of the Mayo score was used to assess mucosal healing. Blood samples were taken for CRP by routine laboratory methods.
2. Statistical Analysis
We compared each CRP and fecal test (FC and FIT) to the partial Mayo score or Mayo endoscopic score. Receiver operator characteristic (ROC) curves were constructed to calculate the accuracy of FIT, FC, and CRP in discriminating between patients with mucosal healing and active endoscopic inflammation, and to identify appropriate cutoff values that maximize area under the curve for markers. The method described by Hanley and McNeil [9] was used to compare the area under the curve (AUC) of the ROC curves for FIT, FC, and CRP and to assess whether these ROC curves were significantly different for patients with UC. A 2-sided P-value <0.05 was considered statistically significant. All analyses were performed using MedCalc version 16.4.3 for Windows (Ostend, Belgium).
Multiple regression analysis was performed to determine whether the combined use of FIT and CRP, FC and CRP were associated with Mayo endoscopic score or partial Mayo score. Before multiple regression analysis, investigated the effect of FIT, FC, and CRP on simple regression analysis of Mayo endoscopic score or partial Mayo score. And then, compared the explanatory power of the single test and the combined test. These analyses were performed using SPSS Statistics version 24.0 (IBM Corp., Armonk, NY, USA).
3. Assay of CRP, Fecal Immunochemical Test and Fecal Calprotectin

1) CRP

Samples obtained by simple blood sampling are assayed for CRP using a Roche cobas-8000 instrument in a laboratory. Immunoassay is a test using an antigen-antibody reaction, and the desired substance can be measured using an antibody that selectively binds to the substance to be measured. To the serum collected from the sample, using anti-human CRP mouse monoclonal antibody-sensitized latex solution 2 mg/mL and 2-amino-2-hydroxymethyl-1, 3-propanediol buffer (Ph 8.5) 20 mmol/L, the agglutination reaction (antigen and antibody) occurs due to the combination of the 2. Usually, when antigen or antibody is attached to erythrocyte, latex, or gelatin, the particle reacts. At aggregation measurement, the degree of light scattering is measured by a turbidimetric method. Adults usually have a CRP of less than 1 mg/L and may increase more than 100-fold depending on the degree of inflammation. The cost of procedure per test is 7,250 KRW (South Korean won).

2) Fecal Immunochemical Test

Using NS Prime equipment stool hemoglobin (Hb) was measured. After adding the sample diluent to the stool sample collected by the patient and adding the fit Hb NS Prime reagent combined latex to the sample, an antigen-antibody complex is formed by the reaction. The turbidity of this complex is proportional to the antigen amount of the stool sample. The turbidity is measured and the concentration is calculated by comparing with the calibration curve prepared by the standard substance of the existing concentration. Those fecal specimens with a Hb concentration of >1,000 ng/mL were categorized one (1,000), the cost of procedure per test is 5,020 KRW.

3) Fecal Calprotectin

Stool samples were sent to a commercial laboratory, and calprotectin was measured by fluorescence enzyme immunoassay (FEIA). Preprocessing was performed using a kit (Phadia AB, Uppsala, Sweden). Briefly, after thawing, appropriate stool samples were homogenized by mixing with a predefined extraction buffer volume. After centrifugation, the supernatants were subjected to FEIA using the Immuno-CAP 250 (Aloka, Tokyo, Japan). The results are reported as numerical quantities, the cost of procedure per test is 19,710 KRW.
4. Ethical Considerations
This study was approved by the Institutional Review Board of Korea University Ansan Hospital (AS16214). Informed consent was not received. There is no reason to estimate the refusal of consent because the retrospective medical record review study uses thoroughly protected data, it is assumed that there was no risk to the patients even if the consent was exempted.
1. Patient Baseline Demographic Variables
The 106 patients were enrolled from March 2015 to August 2016. The main demographic features are presented in Table 1. The mean±SD age was 46.3±16.7 years, and 62 (58.5%) were males. Eight patients were current smokers, and 3 had a family history of IBD. The UC was considered extensive (pancolitis) in 24 (22.6%), left-sided in 48 (45.3%), and proctitis alone in 34 (32.1%).
2. Colonoscopic Findings and Fecal Markers
Among the 106 patients, 86 (81.1%) showed active mucosal inflammation on colonoscopy, with a Mayo endoscopic score ≥2; 42 (39.6%) had a Mayo endoscopic score of 1, 37 (34.9%) had an Mayo endoscopic score of 2, 7 (6.6%) had an Mayo endoscopic score of 3, and 20 (18.9%) had a Mayo endoscopic score of 0. The mean FC level was 671±73.4 mg/kg, the mean FIT value was 485±461 ng/mL, and the mean CRP value was 0.45±1.19 mg/dL.
3. ROC Analyses of Fecal Markers
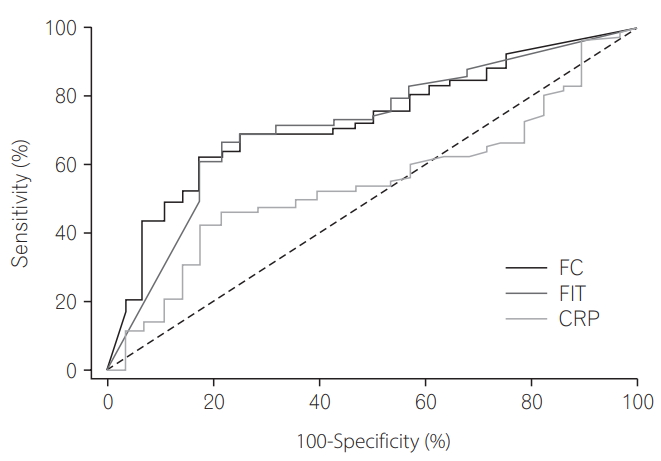
Based on the partial Mayo score, 78 of 106 patients had mild, moderate, or severe activity, and 26 had moderate to severe activity. The AUC of FIT for prediction of partial Mayo score >1 was 0.717, using a cutoff value of 149 ng/mL, yielding 66.7% sensitivity and 78.6% specificity. The AUC of FIT for prediction of partial Mayo score >4 was 0.806, using a cutoff value of 258 ng/mL, yielding 96.2% sensitivity and 62.5% specificity. The AUC of FC for prediction of partial Mayo score >1 was 0.727, using a cutoff value of 322.5 mg/kg, yielding 62.8% sensitivity and 82.1% specificity. The AUC of FC for prediction of partial Mayo score >4 was 0.809, using a cutoff value of 350.7 mg/kg, yielding 88.5% sensitivity and 62.5% specificity (Table 2). The AUC of CRP for prediction of partial Mayo score >1 was 0.549, using a cutoff value of 0.139 mg/dL, yielding 46.2 % sensitivity and 78.6% specificity. The AUC of CRP for prediction of partial Mayo score >4 was 0.69, using a cutoff value of 0.164 mg/dL, yielding 61.5% sensitivity and 76.3% specificity.
The AUCs of FIT and FC for prediction of partial Mayo score >1 were significantly superior to that of CRP, but there was no significant difference between FIT and FC (P=0.0067 [FIT vs. CRP], P=0.0064 [FC vs. CRP], P=0.8643 [FIT vs. FC]) (Tables 3 and 4, Fig. 1) [10].
In patients with moderate to severe activity assessed by partial Mayo score, the AUC for FC (0.809) was greater than the AUC for CRP (0.69) (P=0.047).
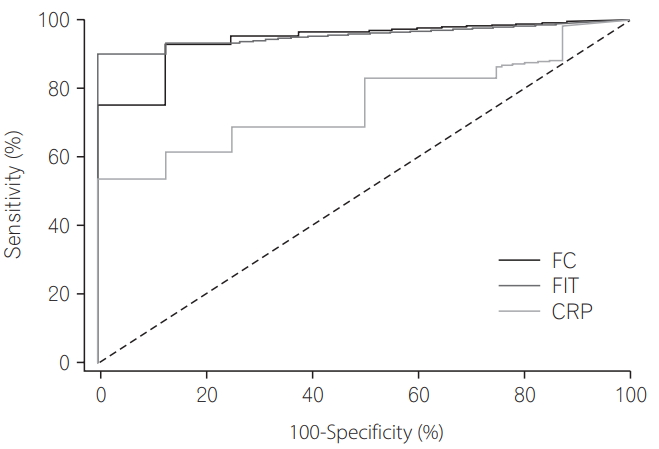
Among 68 patients who underwent endoscopy and stool study within 2 weeks, the AUCs of FIT and FC for the detection of Mayo endoscopic score ≥1 were 0.956 and 0.942, respectively, and were superior to that of CRP (0.756). However, there was no significant difference between FIT and FC (P=0.0010 [FIT vs. CRP], P=0.0328 [FC vs. CRP], P=0.6466 [FIT vs FC]) (Tables 5 and 6, Fig. 2) [10] by pairwise comparison of ROC curves.
To investigate the effect of FIT, FC, and CRP 1 on Mayo endoscopic score, simple regression analysis was performed. As a result, the 3 predictors showed a significant effect (P <0.001). When the FIT increased by 1 (unit), the Mayo endoscopic score increased by 0.001 (unit), FIT was able to explain the Mayo endoscopic score by 30.7% (F=29.21, P =0.000). FC also showed the same increase as FIT, FC showed 24.1% explanatory power (F=20.94, P =0.000). CRP increases by 1 (unit) to 0.227 (unit) in Mayo endoscopic score and CRP showed 15.8% explanatory power (F=12.35, P =0.001), is the lowest predictor (Table 7). Therefore, FIT, FC, and CRP are related to Mayo endoscopic score. When FIT, FC, and CRP increased, Mayo endoscopic score increased significantly.
Multiple regression analysis was performed to examine the extent of Mayo endoscopic score prediction using FIT and CRP or FC and CRP. FIT and CRP are independent of each other and examine whether they meet the normal distribution assumption, Durbin-Watson score 1.907 appears to meet the regression model. FIT and CRP showed a Mayo endoscopic score of 37.7% explanatory power (F=19.69, P =0.000). The Mayo endoscopic score showed that FIT had a 0.21-fold higher influence than CRP. At FC and CRP, Durbin-Watson score 2.009 appears to meet the regression model also. FC and CRP showed a 28.7% explanatory power (F=13.07, P =0.000) and Mayo endoscopic score showed that FC was 0.159-fold higher than CRP (Table 8). At Mayo endoscopic score, the effects of combination of FIT and CRP or FC and CRP were found to be higher than those of the independent FIT or FC.
To investigate the effect of FIT, FC, and CRP on Partial Mayo score, simple regression analysis was performed. As a result, the 3 predictors showed a significant effect (P <0.001). When the FIT increased by 1 (unit), the partial Mayo score increased by 0.003 (unit), FIT was able to explain the partial Mayo score by 30.3% (F=45.28, P =0.000). FC showed 28.7% explanatory power (F=41.81, P =0.000). CRP increases by 1 (unit) to 0.384 (unit) in the partial Mayo score and CRP showed 4.3% explanatory power (F=4.66, P =0.033), is the lowest predictor (Table 9). Therefore, FIT, FC, and CRP are related to partial Mayo score. When FIT, FC, and CRP increased, partial Mayo score increased significantly.
Multiple regression analysis was performed to examine the extent of partial Mayo score prediction using FIT and CRP or FC and CRP. FIT and CRP are independent of each other and examine whether they meet the normal distribution assumption, Durbin-Watson score 1.693 appears to meet the regression model. At combination of FIT and CRP, CRP was not significant factor and the explanatory power was 30.7% (F=22.76, P =0.000). At FC and CRP, Durbin-Watson score 1.707 appears to meet the regression model also. At combination of FC and CRP, CRP was not significant factor also and FC and CRP showed a 28.7% explanatory power (F=20.71, P =0.000). At Partial Mayo score, the effects of combination of FIT and CRP or FC and CRP were found to be not higher than those of the independent FIT or FC significantly (Table 10).
This study demonstrated that FIT can serve as a marker for colonic inflammation in UC patients with a diagnostic accuracy comparable to that of FC. Previous studies have revealed the correlation between endoscopic inflammation and calprotectin levels in IBD [4]. Mucosal healing relates decline in hospitalizations, operations in patients with both UC and CD. FC increases with gut inflammation when neutrophils infiltrate the mucosal tissue in large numbers [3], and FC predicts clinical relapse of disease activity in patients with IBD [5].
In 152 patients with UC, the FIT was investigated as a marker for inflammation [7]. FIT was assessed with a quantitative FIT, which is easily used in sporadic colorectal cancer screening programs [11]. The study found that levels above a cutoff of 100 ng/mL indicated endoscopic inflammation with 60% sensitivity and 87% specificity. Although we used a latex agglutination assay to determine FIT levels, resulting in a different cutoff level, our results are similar to these data, confirming that FIT is an accurate marker for colonic inflammation.
In our study, among 68 patients with intervals less than 2 weeks between colonoscopy and stool testing, the diagnostic accuracy of FIT for identification of patients with inflammation and detection of a Mayo endoscopic score ≥1, was reflected by an AUC of 0.956 for patients with UC; this was similar to the AUC of 0.942 for patients with UC using FC. The AUC of CRP for detection of patients with UC was 0.756. Therefore, FIT is as effective in distinguishing between patients with and without inflammation as calprotectin.
A specific advantage of FC as a marker for inflammation is the fact that it remains stable at room temperature for several days [12]. FIT undergoes some degradation after stool is exposed to air [13]. For this reason, most FIT tests used in random screening for colorectal cancer use a stabilizing buffer contained in the sampling tube [6]. In our study, fecal samples for the evaluation of FIT were collected with a buffer before the start of bowel cleansing and kept refrigerated for up to 1 day on weekdays and a maximum of 3 days on weekends. Thus, we tried to minimize degradation of FIT.
Mucosal healing is associated with a decrease in the number of hospitalizations and resections, as well as the incidence of colorectal cancer in patients with UC [14]. Macroscopic colonoscopic features help predict neoplasia risk in UC. Features of previous/ongoing inflammation signify an increased risk of colorectal neoplasia [15]. To assess whether calprotectin or FIT could be used as markers, we determined the appropriate cutoff values for both, in differentiating between patients with and without endoscopic mucosal inflammation.
In analysis of 106 patients, the AUCs of FIT and FC for the prediction of partial Mayo score >1 were significantly superior to that of CRP. However, there was no significant difference between FIT and FC. Moreover, in patients with moderate to severe activity, FC was superior to CRP (P <0.05). Previous studies showed that calprotectin cutoff levels of 200 and 250 mg/kg had a high predictive value for active disease, ranging between 78% and 100% [4]. Although we used a slightly higher cutoff value of 322.5 mg/kg, this resulted in a lower negative predictive value of 44.2%, compared with previously reported values ranging between 48% and 61% [16], owing to a large percentage of mild to severe patients (73.6%).
Calprotectin levels above the cutoff indicate the presence of inflammation with reasonable accuracy, although this is probably not enough to start treatment and might warrant endoscopic confirmation.
We also assessed the cutoff levels for FIT, and found that 149 ng/mL offers the best compromise, with a sensitivity of 66.7% and specificity of 78.6%. However, there was no significant difference between FIT and FC. In addition, CRP was significantly inferior to FIT and FC.
The ratio of proctitis was large in the patients of this study (32%) (Table 1). At this study, patients having early symptoms of change in melena or bowel habit, visited this hospital. Ulcerative proctitis, one of the disease types of UC, is considered one of the initial manifestations of UC. The number of patients with ulcerative proctitis is increasing. Disease extension occurs in many patients with ulcerative proctitis. Prevention of aggravation of ulcerative proctitis is important for improving the prognosis of UC [17].
Multiple regression analysis was performed to determine whether the combined use of FIT and CRP, FC and CRP were associated with Mayo endoscopic score or partial Mayo score. Before multiple regression analysis, investigated the effect of FIT, FC, and CRP on simple regression analysis of Mayo endoscopic score or partial Mayo score. And then, compared the explanatory power of the single test and the combined test.
FIT was able to explain the Mayo endoscopic score by 30.7% (F=29.21, P =0.000). FC showed 24.1% explanatory power (F=20.94, P =0.000). FIT and CRP showed a Mayo endoscopic score of 37.7% explanatory power (F=19.69, P =0.000). FC and CRP showed a 28.7% explanatory power (F=13.07, P =0.000). At Mayo endoscopic score, the effects of combination of FIT and CRP or FC and CRP were found to be higher than those of the independent FIT or FC.
FIT was able to explain the Partial Mayo score by 30.3% (F=45.28, P =0.000). FC showed 28.7% explanatory power (F=41.81, P =0.000). At combination of FIT and CRP, the explanatory power was 30.7% (F=22.76, P =0.000). FC and CRP showed a 28.7% explanatory power (F=20.718, P =0.000). At Partial Mayo score, the effects of combination of FIT and CRP or FC and CRP were found to be not higher than those of the independent FIT or FC significantly.
Our study has several limitations. As noted, since the number of our study patients with intervals less than 2 weeks between endoscopy and stool study was small, we assessed the correlation between levels of fecal tests (FC and FIT) and partial Mayo score in evaluation of disease severity. Furthermore, the influence of different types of medication on calprotectin levels is unknown, and therefore the different maintenance therapies of the patients in the study might have influenced the results.
In conclusion, our study revealed that in patients with UC, FIT can be used as a marker for colonic inflammation with diagnostic accuracy comparable to that of FC.
FIT and FC can effectively and noninvasively detect mild, moderate, and severe UC better than they detect remission. Moreover, FC can detect UC patients with moderate to severe activity better than it can detect remission of UC or mild UC. Since FIT and FC effectively reflect the status of mucosal inflammation and symptoms, they might be useful in reducing the need for invasive endoscopic examination

FINANCIAL SUPPORT

The authors received no financial support for the research, authorship, and/or publication of this article.

CONFLICT OF INTEREST

No potential conflict of interest relevant to this article was reported.

AUTHOR CONTRIBUTION

Literature search, data collection, data analysis, data interpretation, figures, and writing: Dong Ju Kim; study design and conduct of the clinical trial contributing data to these analyses: Ja Seol Koo; data analysis, data interpretation: Yoon Mi Jeoun; data analysis: Dong-won Lee; endoscopic examination contributing data to these analyses: Sang Woo Lee.

Fig. 1.
Receiver operating characteristic curves for fecal immunochemical test (FIT), fecal calprotectin (FC), and CRP levels, for use in determination of the diagnostic power of biomarkers for prediction of partial Mayo score >1.
ir-2018-00020f1.jpg
Fig. 2.
Receiver operating characteristic curves for fecal immunochemical test (FIT), fecal calprotectin (FC), and CRP levels for use in determination of the diagnostic power of biomarkers for prediction of Mayo endoscopic score ≥1.
ir-2018-00020f2.jpg
Table 1.
Baseline Demographic Variables of 106 UC Patients in This Study
Variable Total
Age (yr) 46.3±16.7
Male sex 62 (58.5)
Current smoker 8 (7.5)
Family history 3 (2.8)
Fecal calprotectin (mg/kg) 671±73.4
FIT (ng/mL) 485±461
CRP (mg/dL) 0.45±1.19
Partial Mayo score
 Mild (2–4) 52 (49.1)
 Moderate (5–6) 18 (16.9)
 Severe (7–9) 8 (7.5)
Endoscopic score
 Mild (1) 42 (39.6)
 Moderate (2) 37 (34.9)
 Severe (3) 7 (6.6)
Disease location (Montreal classification)
 E1 34 (32.1)
 E2 48 (45.3)
 E3 24 (22.6)

Values are presented as mean±SD or number (%).

FIT, fecal immunochemical test.

Table 2.
Sensitivity, Specificity, and Cutoff Levels for Stool Markers, for Use in Determination of Their Diagnostic Power for Prediction of Partial Mayo Score
Sensitivity (%) Specificity (%) Cutoff
Fecal immunochemical test
 Partial Mayo score (>4) 96.2 62.5 258a
 Partial Mayo score (>1) 66.7 78.6 149a
Fecal calprotectin
 Partial Mayo score (>4) 88.5 62.5 350.7b
 Partial Mayo score (>1) 62.8 82.1 322.0b

a The unit is ng/mL.

b The unit is mg/kg.

Table 3.
AUC of CRP, FIT, and FC (n=106)
Variable No. (%) AUC SEa 95% CIb
Positive groupc 78 (73.58) - - -
Negative groupd 28 (26.42) - - -
FC - 0.727 0.0533 0.632–0.809
FIT - 0.717 0.0553 0.622–0.801
CRP - 0.549 0.0605 0.450–0.646

a DeLong ER, et al. [10]

b Binomial exact.

c Partial Mayo score >1.

d Partial Mayo score 0 or 1.

AUC, area under the curve; FIT, fecal immunochemical test; FC, fecal calprotectin; SE, standard error.

Table 4.
Pairwise Comparison of ROC Curves
Difference between areas SEa 95% CI P-valueb
FC vs. FIT 0.00962 0.0563 –0.101 to 0.120 0.8643
FC vs. CRP 0.17800 0.0652 0.0499 to 0.305 0.0064
FIT vs. CRP 0.16800 0.0620 0.0465 to 0.290 0.0067

a DeLong ER, et al. [10]

b Significance level.

ROC, receiver operator characteristic; SE, standard error; FC, fecal calprotectin; FIT, fecal immunochemical test.

Table 5.
AUC of CRP, FIT, and FC (n=68)
Variable No. (%) AUC SEa 95% CIb
Positive groupc 60 (88.24) - - -
Negative groupd 8 (11.76) - - -
FC - 0.942 0.0341 0.857–0.984
FIT - 0.956 0.0225 0.877–0.991
CRP - 0.756 0.0682 0.637–0.852

a DeLong ER, et al. [10]

b Binomial exact.

c Mayo endoscopic score ≥1.

d Mayo endoscopic score 0.

AUC, area under the curve; FIT, fecal immunochemical test; FC, fecal calprotectin; SE, standard error.

Table 6.
Pairwise Comparison of ROC Curves
Difference between areas SEa 95% CI P-valueb
FC vs. FIT 0.0146 0.0318 –0.0478 to 0.0769 0.6466
FC vs. CRP 0.1850 0.0869 0.0152 to 0.3560 0.0328
FIT vs. CRP 0.2000 0.0781 0.0470 to 0.3530 0.0104

a DeLong ER, et al. [10]

b Significance level.

ROC, receiver operator characteristic; SE, standard error; FC, fecal calprotectin; FIT, fecal immunochemical test.

Table 7.
Simple Regression Analysis to Investigate the Effect of FIT, FC, and CRP on Mayo Endoscopic Score (n=68)
Variable B SE β t P-value R2 F P-value
Constant 0.909 0.141 - 6.45 0.000 - - -
FIT 0.001 0.000 0.554 5.40 0.000 0.307 29.21 0.000
Constant 1.050 0.135 - 7.78 0.000 - - -
FC 0.001 0.000 0.491 4.57 0.000 0.241 20.94 0.000
Constant 1.375 0.102 - 13.47 0.000 - - -
CRP 0.227 0.065 0.397 3.51 0.001 0.158 12.35 0.001

FIT, fecal immunochemical test; FC, fecal calprotectin; SE, standard error.

Table 8.
Multiple Regression Analysis to Examine the Extent of Mayo Endoscopic Score Prediction Using FIT and CRP or FC and CRP (n=68)
Variable B β t P-value R2 R2 F P-value
1. FIT 0.001 0.484 4.78 0.000 0.377 0.358 19.69 0.000
 CRP 0.157 0.274 2.71 0.009
2. FC 0.000 0.394 3.43 0.001 0.287 0.265 13.07 0.000
 CRP 0.135 0.235 2.04 0.045

FIT, fecal immunochemical test; FC, fecal calprotectin.

Table 9.
Simple Regression Analysis to Investigate the Effect of FIT, FC, and CRP on Partial Mayo Score (n=106)
Variable B SE β t P-value R2 F P-value
Constant 1.525 0.263 5.79 0.000
FIT 0.003 0.000 0.551 6.72 0.000 0.303 45.28 0.000
Constant 1.720 0.248 6.95 0.000
FC 0.002 0.000 0.536 6.45 0.000 0.287 41.81 0.000
Constant 2.636 0.227 11.62 0.000
CRP 0.384 0.178 0.207 2.16 0.033 0.043 4.66 0.033

FIT, fecal immunochemical test; FC, fecal calprotectin; SE, standard error.

Table 10.
Multiple Regression Analysis to Examine the Extent of Partial Mayo Score Prediction Using FIT and CRP or FC and CRP (n=106)
Variable B β t P-value R2 R2 F P-value
1. FIT 0.003 0.534 6.250 0.000 0.307 0.307 22.76 0.000
 CRP 0.110 0.059 0.694 0.489
2. FC 0.002 0.540 5.936 0.000 0.287 0.287 20.71 0.000
 CRP –0.022 –0.012 –0.131 0.896

FIT, fecal immunochemical test; FC, fecal calprotectin.

  • 1. Gomes P, du Boulay C, Smith CL, Holdstock G. Relationship between disease activity indices and colonoscopic findings in patients with colonic inflammatory bowel disease. Gut 1986;27:92–95.ArticlePubMedPMC
  • 2. Brophy MB, Nolan EM. Manganese and microbial pathogenesis: sequestration by the mammalian immune system and utilization by microorganisms. ACS Chem Biol 2015;10:641–651.ArticlePubMedPMC
  • 3. Langhorst J, Elsenbruch S, Koelzer J, Rueffer A, Michalsen A, Dobos GJ. Noninvasive markers in the assessment of intestinal inflammation in inflammatory bowel diseases: performance of fecal lactoferrin, calprotectin, and PMN-elastase, CRP, and clinical indices. Am J Gastroenterol 2008;103:162–169.ArticlePubMed
  • 4. D’Haens G, Ferrante M, Vermeire S, et al. Fecal calprotectin is a surrogate marker for endoscopic lesions in inflammatory bowel disease. Inflamm Bowel Dis 2012;18:2218–2224.ArticlePubMed
  • 5. Tibble JA, Sigthorsson G, Bridger S, Fagerhol MK, Bjarnason I. Surrogate markers of intestinal inflammation are predictive of relapse in patients with inflammatory bowel disease. Gastroenterology 2000;119:15–22.ArticlePubMed
  • 6. Levi Z, Rozen P, Hazazi R, et al. A quantitative immunochemical fecal occult blood test for colorectal neoplasia. Ann Intern Med 2007;146:244–255.ArticlePubMed
  • 7. Nakarai A, Kato J, Hiraoka S, et al. Evaluation of mucosal healing of ulcerative colitis by a quantitative fecal immunochemical test. Am J Gastroenterol 2013;108:83–89.ArticlePubMedPDF
  • 8. Schroeder KW, Tremaine WJ, Ilstrup DM. Coated oral 5-aminosalicylic acid therapy for mildly to moderately active ulcerative colitis: a randomized study. N Engl J Med 1987;317:1625–1629.ArticlePubMed
  • 9. Hanley JA, McNeil BJ. A method of comparing the areas under receiver operating characteristic curves derived from the same cases. Radiology 1983;148:839–843.ArticlePubMed
  • 10. DeLong ER, DeLong DM, Clarke-Pearson DL. Comparing the areas under two or more correlated receiver operating characteristic curves: a nonparametric approach. Biometrics 1988;44:837–845.ArticlePubMed
  • 11. Vilkin A, Rozen P, Levi Z, et al. Performance characteristics and evaluation of an automated-developed and quantitative, immunochemical, fecal occult blood screening test. Am J Gastroenterol 2005;100:2519–2525.ArticlePubMed
  • 12. Røseth AG, Fagerhol MK, Aadland E, Schjønsby H. Assessment of the neutrophil dominating protein calprotectin in feces: a methodologic study. Scand J Gastroenterol 1992;27:793–798.ArticlePubMed
  • 13. Rose IS, Young GP, St John DJ, Deacon MC, Blake D, Henderson RW. Effect of ingestion of hemoproteins on fecal excretion of hemes and porphyrins. Clin Chem 1989;35:2290–2296.ArticlePubMed
  • 14. Colombel JF, Rutgeerts P, Reinisch W, et al. Early mucosal healing with infliximab is associated with improved long-term clinical outcomes in ulcerative colitis. Gastroenterology 2011;141:1194–1201.ArticlePubMed
  • 15. Rutter MD, Saunders BP, Wilkinson KH, et al. Cancer surveillance in longstanding ulcerative colitis: endoscopic appearances help predict cancer risk. Gut 2004;53:1813–1816.ArticlePubMedPMC
  • 16. Sipponen T, Savilahti E, Kolho KL, Nuutinen H, Turunen U, Färkkilä M. Crohn’s disease activity assessed by fecal calprotectin and lactoferrin: correlation with Crohn’s disease activity index and endoscopic findings. Inflamm Bowel Dis 2008;14:40–46.ArticlePubMed
  • 17. Kato S, Ishibashi A, Kani K, Yakabi K. Optimized management of ulcerative proctitis: when and how to use mesalazine suppository. Digestion 2018;97:59–63.ArticlePubMed

Figure & Data

REFERENCES

    Citations

    Citations to this article as recorded by  
    • Histologic features and predicting prognosis in ulcerative colitis patients with mild endoscopic activity
      Seung Yong Shin, Hee Sung Kim, Kisung Kim, Chang Won Choi, Jung Min Moon, Jeong Wook Kim, Hyun Jin Joo, Jeongkuk Seo, Muhyeon Sung, Chang Hwan Choi
      The Korean Journal of Internal Medicine.2024; 39(1): 68.     CrossRef
    • Prostaglandin E‐major urinary metabolite diagnoses mucosal healing in patients with ulcerative colitis in remission phase
      Toshiyuki Sakurai, Yoshihiro Akita, Haruna Miyashita, Ryosuke Miyazaki, Yuki Maruyama, Tomoko Saito, Mariko Shimada, Takuji Yamasaki, Seiji Arhihiro, Tomohiro Kato, Tomokazu Matsuura, Masahiro Ikegami, Isao Okayasu, Masayuki Saruta
      Journal of Gastroenterology and Hepatology.2022; 37(5): 847.     CrossRef
    • Alternative diagnoses and demographics associated with a raised quantitative faecal immunochemical test in symptomatic patients
      Mark S Johnstone, Gillian Miller, Grace Pang, Paul Burton, Georgios Kourounis, Jack Winter, Emilia Crighton, David Mansouri, Paul Witherspoon, Karen Smith, Stephen T McSorley
      Annals of Clinical Biochemistry: International Journal of Laboratory Medicine.2022; 59(4): 277.     CrossRef
    • Correlation of fecal calprotectin and patient-reported outcome measures in patients with ulcerative colitis
      Nagesh Kamat, Sudheer K Vuyyuru, Saurabh Kedia, Pabitra Sahu, Bhaskar Kante, Peeyush Kumar, Mukesh Kumar Ranjan, Mukesh Kumar Singh, Sambuddha Kumar, Vikas Sachdev, Govind Makharia, Vineet Ahuja
      Intestinal Research.2022; 20(2): 269.     CrossRef
    • Determining the usefulness of Capsule Scoring of Ulcerative Colitis in predicting relapse of inactive ulcerative colitis
      Mao Matsubayashi, Taku Kobayashi, Shinji Okabayashi, Masaru Nakano, Shintaro Sagami, Ryo Ozaki, Hiroki Kiyohara, Hiromu Morikubo, Kunio Asonuma, Yusuke Miyatani, Shin Maeda, Toshifumi Hibi
      Journal of Gastroenterology and Hepatology.2021; 36(4): 943.     CrossRef
    • Biomarkers of Inflammation in Inflammatory Bowel Disease: How Long before Abandoning Single-Marker Approaches?
      Gabriele Dragoni, Tommaso Innocenti, Andrea Galli
      Digestive Diseases.2021; 39(3): 190.     CrossRef
    • Biomarkers Predictive of Response to Thiopurine Therapy in Inflammatory Bowel Disease
      Jack S. Cornish, Elisa Wirthgen, Jan Däbritz
      Frontiers in Medicine.2020;[Epub]     CrossRef
    • Predictive values of stool-based tests for mucosal healing among Taiwanese patients with ulcerative colitis: a retrospective cohort analysis
      Hsu-Heng Yen, Mei-Wen Chen, Yu-Yao Chang, Hsuan-Yuan Huang, Tsui-Chun Hsu, Yang-Yuan Chen
      PeerJ.2020; 8: e9537.     CrossRef
    • What is the appropriate cut-off value of CRP to predict endoscopic remission in patients with ulcerative colitis in clinical remission?
      Jongbeom Shin, Sung Min Kong, Gyeol Seong, Young-Ho Kim
      International Journal of Colorectal Disease.2020; 35(12): 2249.     CrossRef
    • Prostaglandin E-Major Urinary Metabolite Predicts Relapse in Patients With Ulcerative Colitis in Clinical Remission
      Natsuki Ishida, Kiichi Sugiura, Takahiro Miyazu, Satoshi Tamura, Satoshi Suzuki, Shinya Tani, Mihoko Yamade, Moriya Iwaizumi, Yasushi Hamaya, Satoshi Osawa, Takahisa Furuta, Ken Sugimoto
      Clinical and Translational Gastroenterology.2020; 11(12): e00289.     CrossRef
    • Approaches to Integrating Biomarkers Into Clinical Trials and Care Pathways as Targets for the Treatment of Inflammatory Bowel Diseases
      Parambir S. Dulai, Laurent Peyrin-Biroulet, Silvio Danese, Bruce E. Sands, Axel Dignass, Dan Turner, Gerassimos Mantzaris, Juergen Schölmerich, Jean-Yves Mary, Walter Reinisch, William J. Sandborn
      Gastroenterology.2019; 157(4): 1032.     CrossRef

    • PubReader PubReader
    • ePub LinkePub Link
    • Cite
      CITE
      export Copy Download
      Close
      Download Citation
      Download a citation file in RIS format that can be imported by all major citation management software, including EndNote, ProCite, RefWorks, and Reference Manager.

      Format:
      • RIS — For EndNote, ProCite, RefWorks, and most other reference management software
      • BibTeX — For JabRef, BibDesk, and other BibTeX-specific software
      Include:
      • Citation for the content below
      Usefulness of fecal immunochemical test and fecal calprotectin for detection of active ulcerative colitis
      Intest Res. 2018;16(4):563-570.   Published online October 10, 2018
      Close
    • XML DownloadXML Download
    Figure
    • 0
    • 1
    Related articles
    Usefulness of fecal immunochemical test and fecal calprotectin for detection of active ulcerative colitis
    Image Image
    Fig. 1. Receiver operating characteristic curves for fecal immunochemical test (FIT), fecal calprotectin (FC), and CRP levels, for use in determination of the diagnostic power of biomarkers for prediction of partial Mayo score >1.
    Fig. 2. Receiver operating characteristic curves for fecal immunochemical test (FIT), fecal calprotectin (FC), and CRP levels for use in determination of the diagnostic power of biomarkers for prediction of Mayo endoscopic score ≥1.
    Usefulness of fecal immunochemical test and fecal calprotectin for detection of active ulcerative colitis
    Variable Total
    Age (yr) 46.3±16.7
    Male sex 62 (58.5)
    Current smoker 8 (7.5)
    Family history 3 (2.8)
    Fecal calprotectin (mg/kg) 671±73.4
    FIT (ng/mL) 485±461
    CRP (mg/dL) 0.45±1.19
    Partial Mayo score
     Mild (2–4) 52 (49.1)
     Moderate (5–6) 18 (16.9)
     Severe (7–9) 8 (7.5)
    Endoscopic score
     Mild (1) 42 (39.6)
     Moderate (2) 37 (34.9)
     Severe (3) 7 (6.6)
    Disease location (Montreal classification)
     E1 34 (32.1)
     E2 48 (45.3)
     E3 24 (22.6)
    Sensitivity (%) Specificity (%) Cutoff
    Fecal immunochemical test
     Partial Mayo score (>4) 96.2 62.5 258a
     Partial Mayo score (>1) 66.7 78.6 149a
    Fecal calprotectin
     Partial Mayo score (>4) 88.5 62.5 350.7b
     Partial Mayo score (>1) 62.8 82.1 322.0b
    Variable No. (%) AUC SEa 95% CIb
    Positive groupc 78 (73.58) - - -
    Negative groupd 28 (26.42) - - -
    FC - 0.727 0.0533 0.632–0.809
    FIT - 0.717 0.0553 0.622–0.801
    CRP - 0.549 0.0605 0.450–0.646
    Difference between areas SEa 95% CI P-valueb
    FC vs. FIT 0.00962 0.0563 –0.101 to 0.120 0.8643
    FC vs. CRP 0.17800 0.0652 0.0499 to 0.305 0.0064
    FIT vs. CRP 0.16800 0.0620 0.0465 to 0.290 0.0067
    Variable No. (%) AUC SEa 95% CIb
    Positive groupc 60 (88.24) - - -
    Negative groupd 8 (11.76) - - -
    FC - 0.942 0.0341 0.857–0.984
    FIT - 0.956 0.0225 0.877–0.991
    CRP - 0.756 0.0682 0.637–0.852
    Difference between areas SEa 95% CI P-valueb
    FC vs. FIT 0.0146 0.0318 –0.0478 to 0.0769 0.6466
    FC vs. CRP 0.1850 0.0869 0.0152 to 0.3560 0.0328
    FIT vs. CRP 0.2000 0.0781 0.0470 to 0.3530 0.0104
    Variable B SE β t P-value R2 F P-value
    Constant 0.909 0.141 - 6.45 0.000 - - -
    FIT 0.001 0.000 0.554 5.40 0.000 0.307 29.21 0.000
    Constant 1.050 0.135 - 7.78 0.000 - - -
    FC 0.001 0.000 0.491 4.57 0.000 0.241 20.94 0.000
    Constant 1.375 0.102 - 13.47 0.000 - - -
    CRP 0.227 0.065 0.397 3.51 0.001 0.158 12.35 0.001
    Variable B β t P-value R2 R2 F P-value
    1. FIT 0.001 0.484 4.78 0.000 0.377 0.358 19.69 0.000
     CRP 0.157 0.274 2.71 0.009
    2. FC 0.000 0.394 3.43 0.001 0.287 0.265 13.07 0.000
     CRP 0.135 0.235 2.04 0.045
    Variable B SE β t P-value R2 F P-value
    Constant 1.525 0.263 5.79 0.000
    FIT 0.003 0.000 0.551 6.72 0.000 0.303 45.28 0.000
    Constant 1.720 0.248 6.95 0.000
    FC 0.002 0.000 0.536 6.45 0.000 0.287 41.81 0.000
    Constant 2.636 0.227 11.62 0.000
    CRP 0.384 0.178 0.207 2.16 0.033 0.043 4.66 0.033
    Variable B β t P-value R2 R2 F P-value
    1. FIT 0.003 0.534 6.250 0.000 0.307 0.307 22.76 0.000
     CRP 0.110 0.059 0.694 0.489
    2. FC 0.002 0.540 5.936 0.000 0.287 0.287 20.71 0.000
     CRP –0.022 –0.012 –0.131 0.896
    Table 1. Baseline Demographic Variables of 106 UC Patients in This Study

    Values are presented as mean±SD or number (%).

    FIT, fecal immunochemical test.

    Table 2. Sensitivity, Specificity, and Cutoff Levels for Stool Markers, for Use in Determination of Their Diagnostic Power for Prediction of Partial Mayo Score

    The unit is ng/mL.

    The unit is mg/kg.

    Table 3. AUC of CRP, FIT, and FC (n=106)

    DeLong ER, et al. [10]

    Binomial exact.

    Partial Mayo score >1.

    Partial Mayo score 0 or 1.

    AUC, area under the curve; FIT, fecal immunochemical test; FC, fecal calprotectin; SE, standard error.

    Table 4. Pairwise Comparison of ROC Curves

    DeLong ER, et al. [10]

    Significance level.

    ROC, receiver operator characteristic; SE, standard error; FC, fecal calprotectin; FIT, fecal immunochemical test.

    Table 5. AUC of CRP, FIT, and FC (n=68)

    DeLong ER, et al. [10]

    Binomial exact.

    Mayo endoscopic score ≥1.

    Mayo endoscopic score 0.

    AUC, area under the curve; FIT, fecal immunochemical test; FC, fecal calprotectin; SE, standard error.

    Table 6. Pairwise Comparison of ROC Curves

    DeLong ER, et al. [10]

    Significance level.

    ROC, receiver operator characteristic; SE, standard error; FC, fecal calprotectin; FIT, fecal immunochemical test.

    Table 7. Simple Regression Analysis to Investigate the Effect of FIT, FC, and CRP on Mayo Endoscopic Score (n=68)

    FIT, fecal immunochemical test; FC, fecal calprotectin; SE, standard error.

    Table 8. Multiple Regression Analysis to Examine the Extent of Mayo Endoscopic Score Prediction Using FIT and CRP or FC and CRP (n=68)

    FIT, fecal immunochemical test; FC, fecal calprotectin.

    Table 9. Simple Regression Analysis to Investigate the Effect of FIT, FC, and CRP on Partial Mayo Score (n=106)

    FIT, fecal immunochemical test; FC, fecal calprotectin; SE, standard error.

    Table 10. Multiple Regression Analysis to Examine the Extent of Partial Mayo Score Prediction Using FIT and CRP or FC and CRP (n=106)

    FIT, fecal immunochemical test; FC, fecal calprotectin.


    Intest Res : Intestinal Research
    Close layer
    TOP